Overview
When configuring Connectors in Bizagi, you may rely on several features for error control and diagnostics.
One of these features is the use of Traces whenever you detect there is an issue with the execution of the connector, and you want to retrieve further detail.
Connector traces
Whenever you are debugging a Connector's execution (in Development environments) or whenever you wish to retrieve further detail about a failed execution, you may choose to turn on the External connectors' traces.
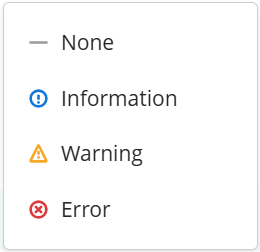
Click the hyphen symbol ( - ) to choose the level of detail you want to apply to this trace. You can choose among:
•None
•Information
•Warning
•Error
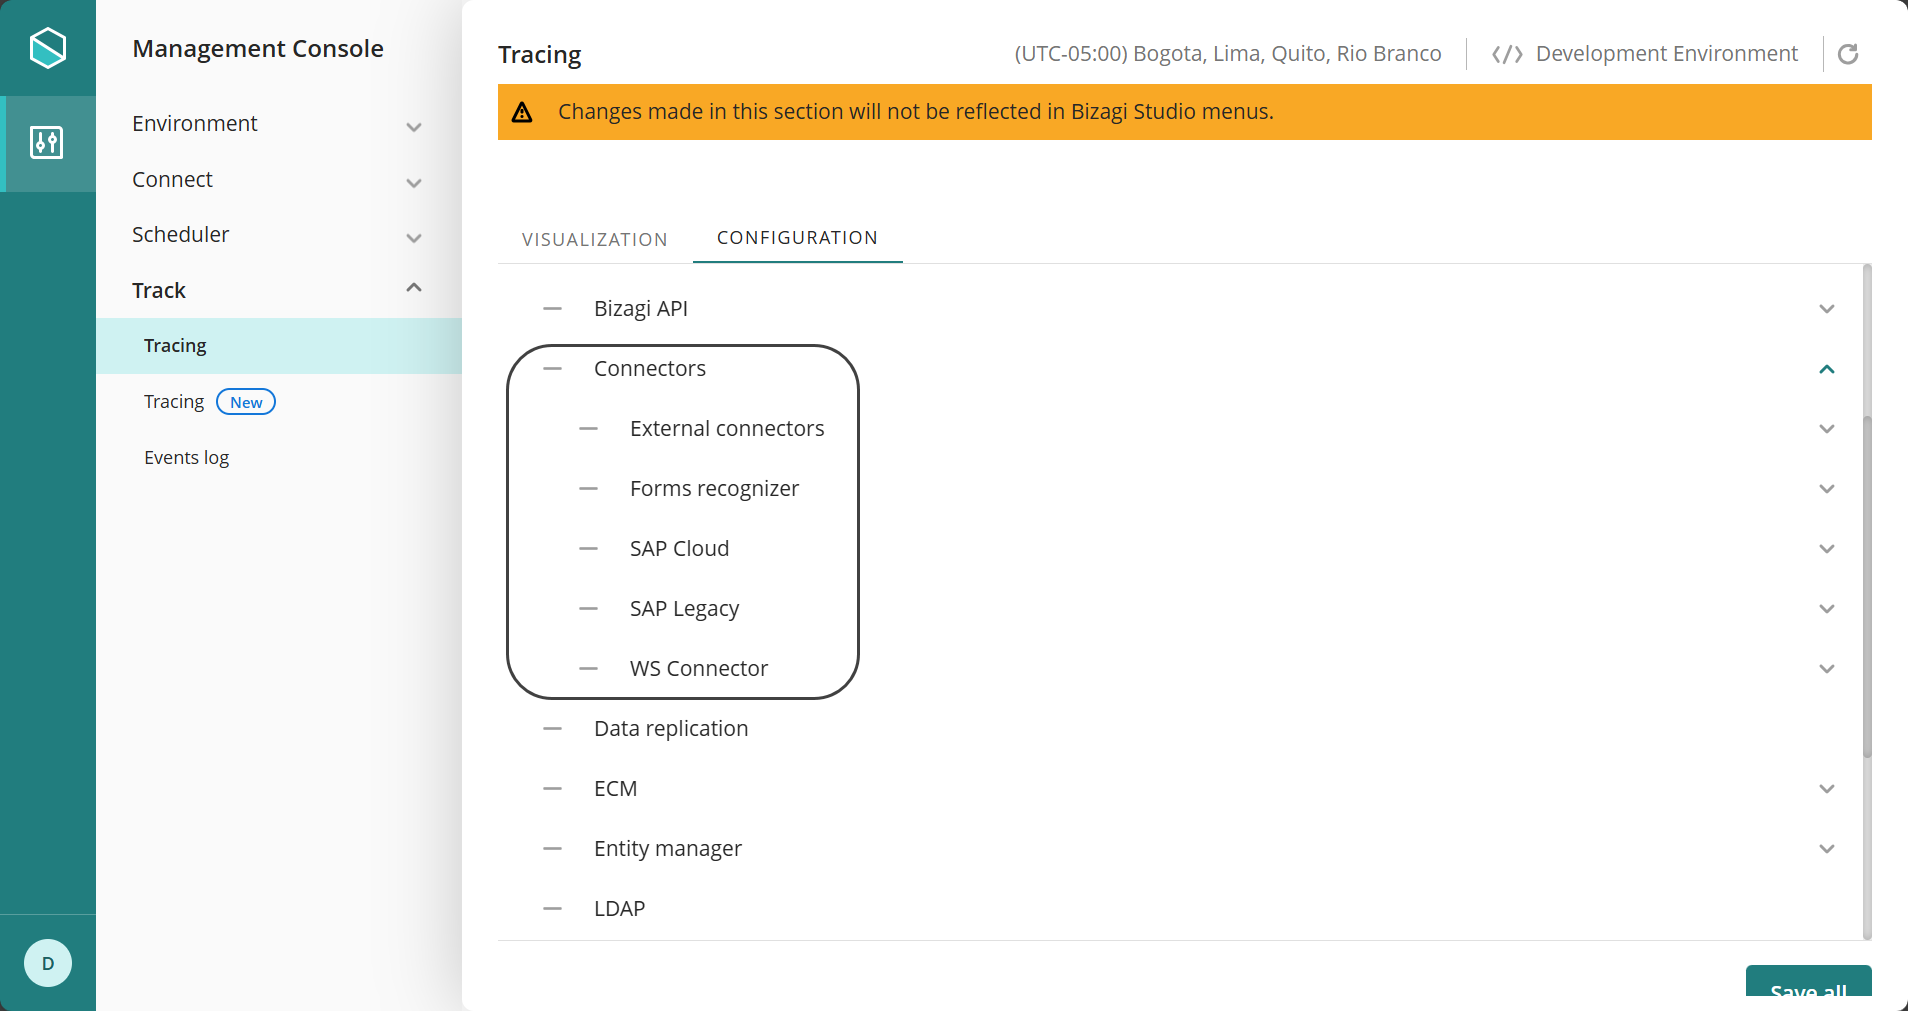
Through the Tracing options, enable the trace for Connectors.
In the Management Console: Go to Track category and open it to see more options. click Tracing. Locate the Visualization Tab and in the Category drop-down list, click Connectors.
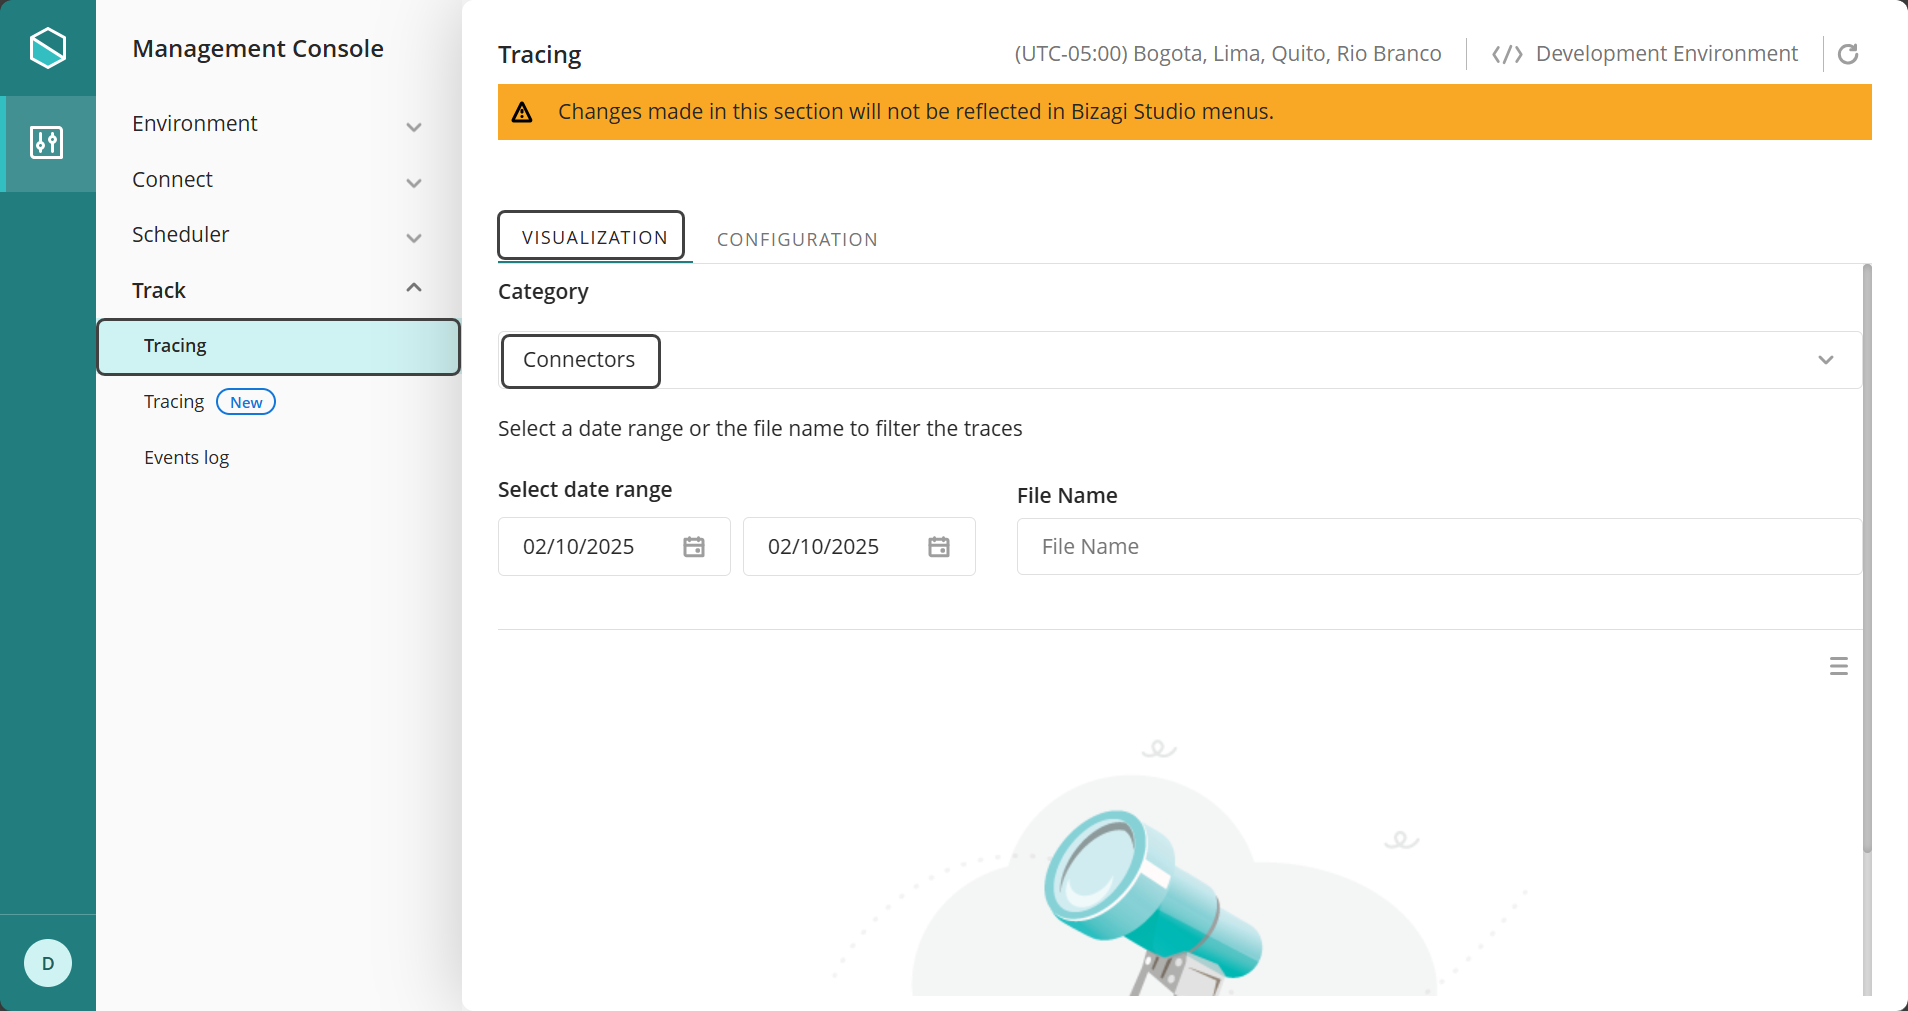
A list appears where you can see all the generated files.
|
Keep in mind that Connector traces can be enabled at any time; however, it is strongly recommended to enable them only temporarily when needed, and to disable them afterward.
Changes in this configuration will most likely require a reset in your Bizagi server's services. |
Enabling traces allows you to pinpoint the exact location and moment when an error occurs in the application. Logs are captured at five key points, helping you diagnose execution issues or transformation errors in the Connector.
Types of traces
The following traces are logged as detailed in the table below.
Chronological order |
Trace type |
Description |
|---|---|---|
1 |
Inputs |
Leaves a JSON file with the inputs sent to the Connector before the execution of its logic. Its name has the following convention: [timestamp]_[case_identifier]_IN0_[Connector name]_[action name].json Note that timestamp is set as yyyyMMddHHmmss. |
2 |
Inputs transformed |
Leaves a JSON file with the inputs sent to the Connector after the execution of its logic. Its name has the following convention: [timestamp]_[case_identifier]_IN1_[Connector name]_[action name].json Note that timestamp is set as yyyyMMddHHmmss. |
3 |
Outputs |
Leaves a JSON file with the outputs received from the external system before any transformation done by Bizagi. Its name has the following convention: [timestamp]_[case_identifier]_OU0_[Connector name]_[action name].json Note that timestamp is set as yyyyMMddHHmmss. |
4 |
Outputs transformed |
Leaves a JSON file with the outputs received from the external system after all transformations done by Bizagi. Its name has the following convention: [timestamp]_[case_identifier]_OU1_[Connector name]_[action name].json Note that timestamp is set as yyyyMMddHHmmss. |
5 |
Connector logic |
Leaves four .log files: Connector log •[connector name].[connector name].log stores all the LOG commands found during the Connector logic execution. More information about these commands refer to the API for connectors documentation. Service logs •bz-facade.log stores the history of methods invoked by the Connector Service. •facade-exceptions.log stores the errors raised by asynchronous functions. For example, error in the callback of a REST request. •[connector name]-bz-ctrl.log stores the logs of the connector service controller.
Note that timestamp is set as yyyyMMddHHmm. |
Additional measure oriented to error control
It is strongly recommended that you also define the service's expected time, so that you can explicitly assign both: a timeout for the service, and a logging threshold.
These properties can be set at the specific interface's properties:
•The logging threshold parameter for interfaces leaves a log to alert you about those interfaces whose invocations are delaying more than expected (more than usual). In this way, you can perform early diagnostics on your Web service and any additional variables affecting its performance.
•The timeout thrown in a service invocation is due to the service delaying more than its timeout definition.
For a service invoked in an asynchronous activity, the timeout definition is taken from the minimum time set from either: the timeout property set for the asynchronous task, or the timeout property set for the specific interface (through interfaces administration in the systems module).
How to trace your connector?
With the following steps, we will illustrate how to use the interface invocations trace to detect and diagnose issues in connector invocations.
Detect the error
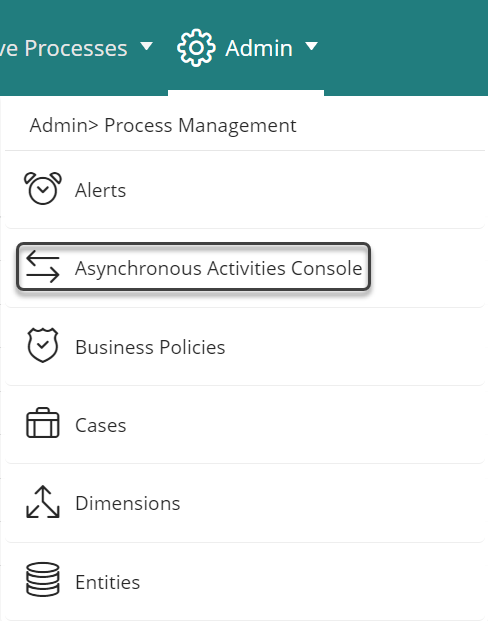
As a most common practice, you may find that your connector is invoked from an Asynchronous Activity.
If the invocation fails, further error detail can be viewed from the Admin menu, in the Asynchronous Activities console option.
Last Updated 5/16/2025 9:44:10 AM