Overview
When configuring Rules and Expressions invocations in Bizagi, you may rely on the use of traces for error control and diagnostics.
Traces let you detect whenever there is an issue with the Rules and Expressions invocation and retrieve further detail.
Rules and Expressions traces
Whenever you are debugging a Rules and Expressions invocation (in Development environments) or whenever you wish to retrieve further detail about a failed invocation, you may choose to turn on the Rules and Expressions traces. Within Rules and Expressions traces, you can delve deeper into two specific types:
•User requests
•Validation of request sessions
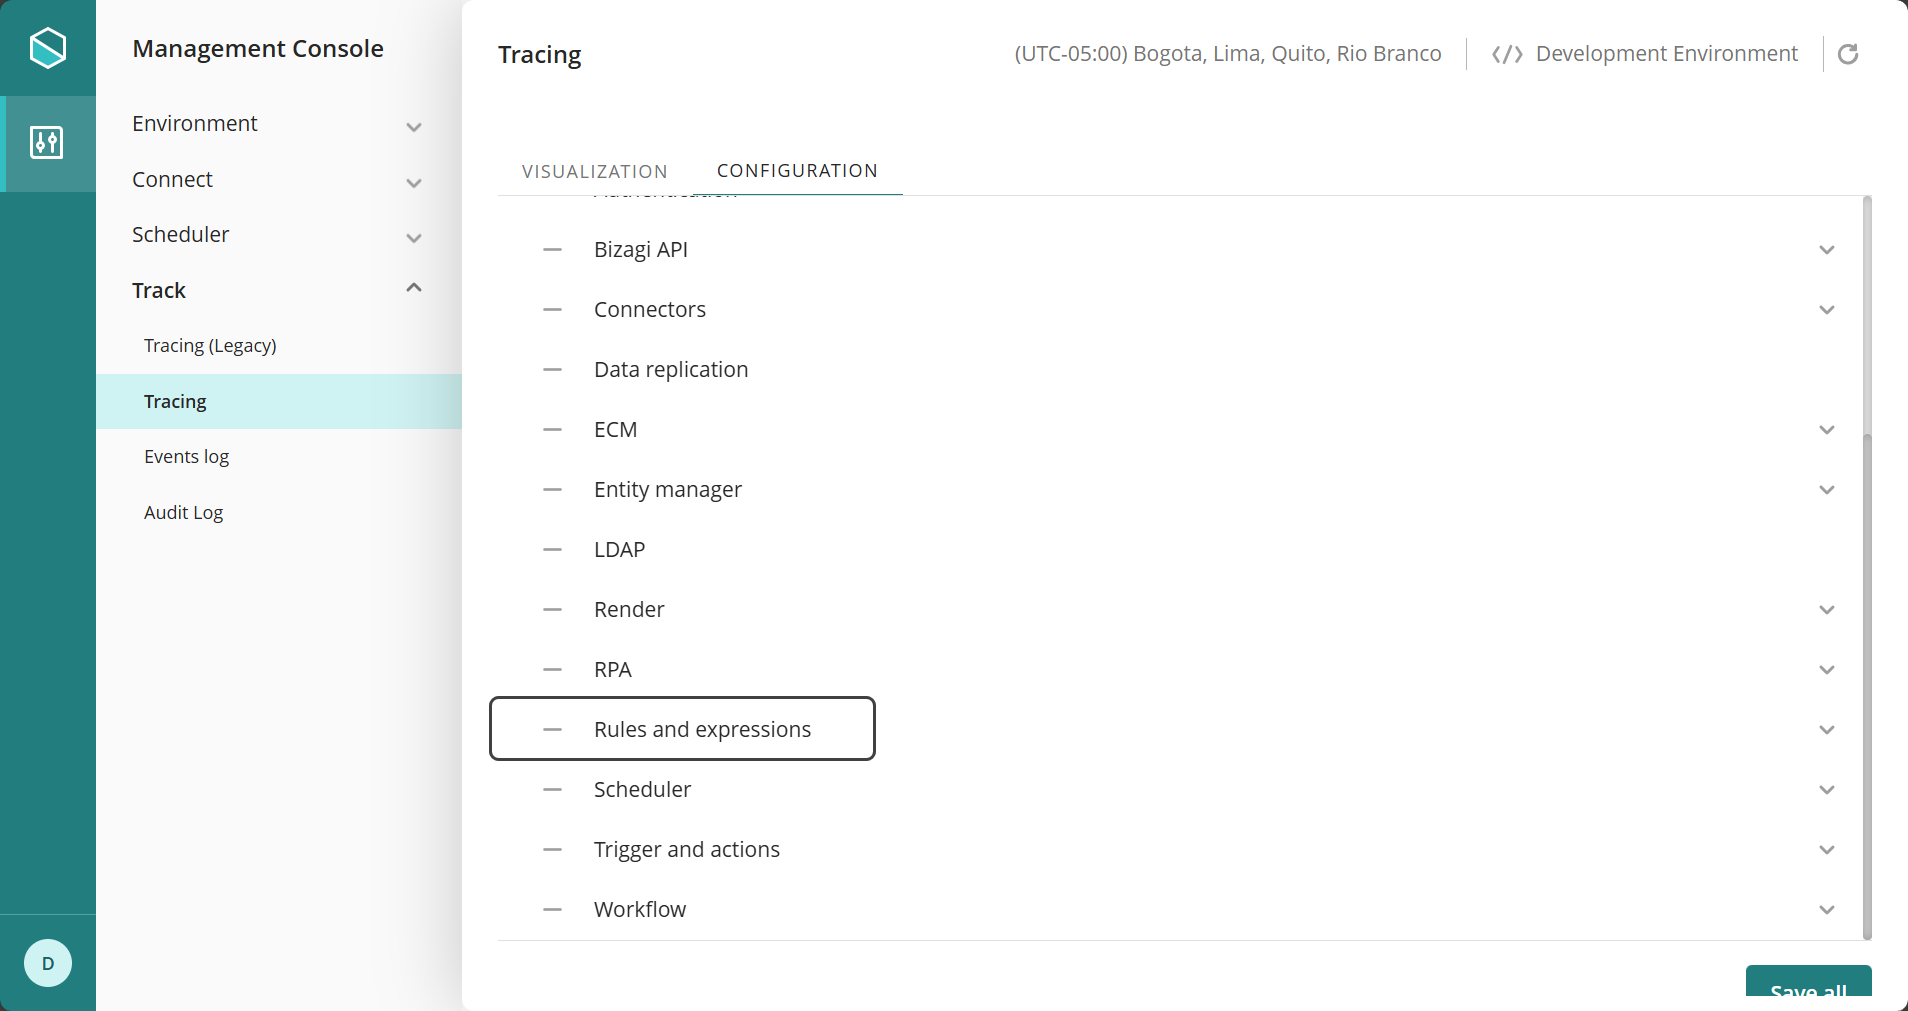
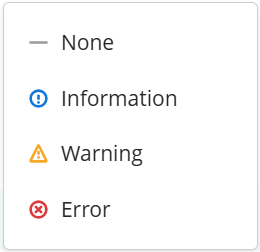
Click the hyphen symbol ( - ) to choose the level of detail you want to apply to this trace. You can choose among:
•None
•Information
•Warning
•Error
|
Keep in mind that Rules and Expressions traces can be enabled at any time; however, it is strongly recommended to enable them only temporarily when needed, and to disable them afterward.
Changes in this configuration will most likely require a reset in your Bizagi server's services. |
Enabling these traces is useful to track down, after an error in the application, the exact point where said error has happened.
How to trace your Rules and Expressions execution
With the following steps, we will illustrate how to use traces to detect and diagnose issues in Rules and Expressions invocations.
View Rules and Expressions traces
1.Setup the traces configuration in Bizagi Studio, as mentioned at the beginning of this article.
2.Through the Tracing options, enable the trace for All.
3.In the Management Console: Go to Track category and open it to see more options. click Tracing. Locate the Visualization Tab and in the Category drop-down list, click All.
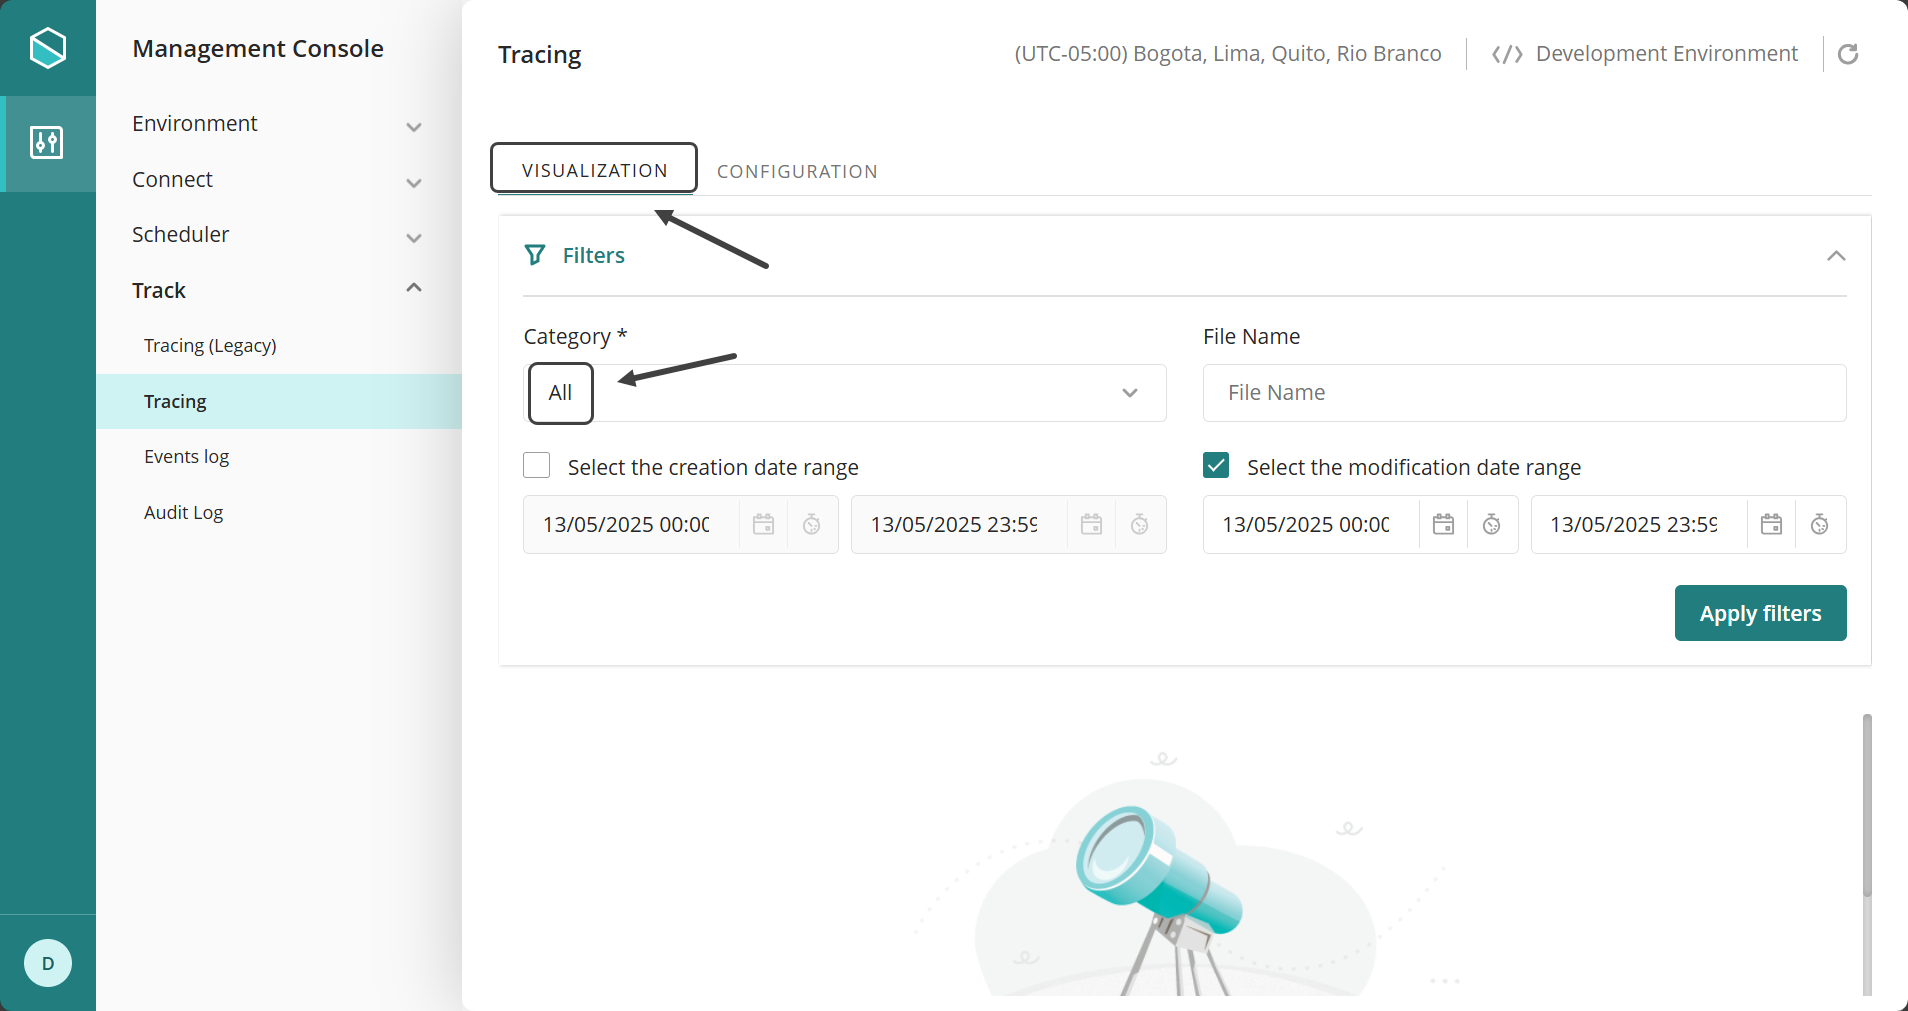
A list appears where you can see all the generated files.
Last Updated 5/16/2025 11:23:30 AM