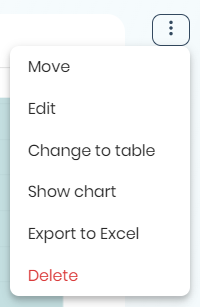
Overview
This section explains the menu options of a result once it has been saved in a dashboard.
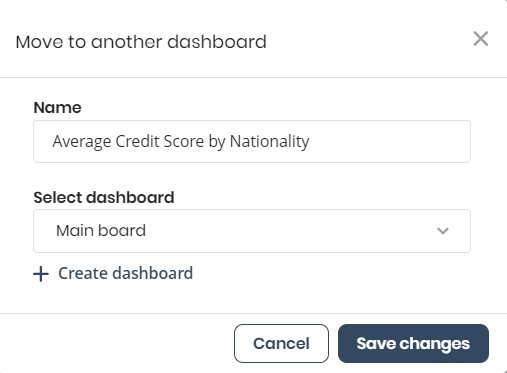
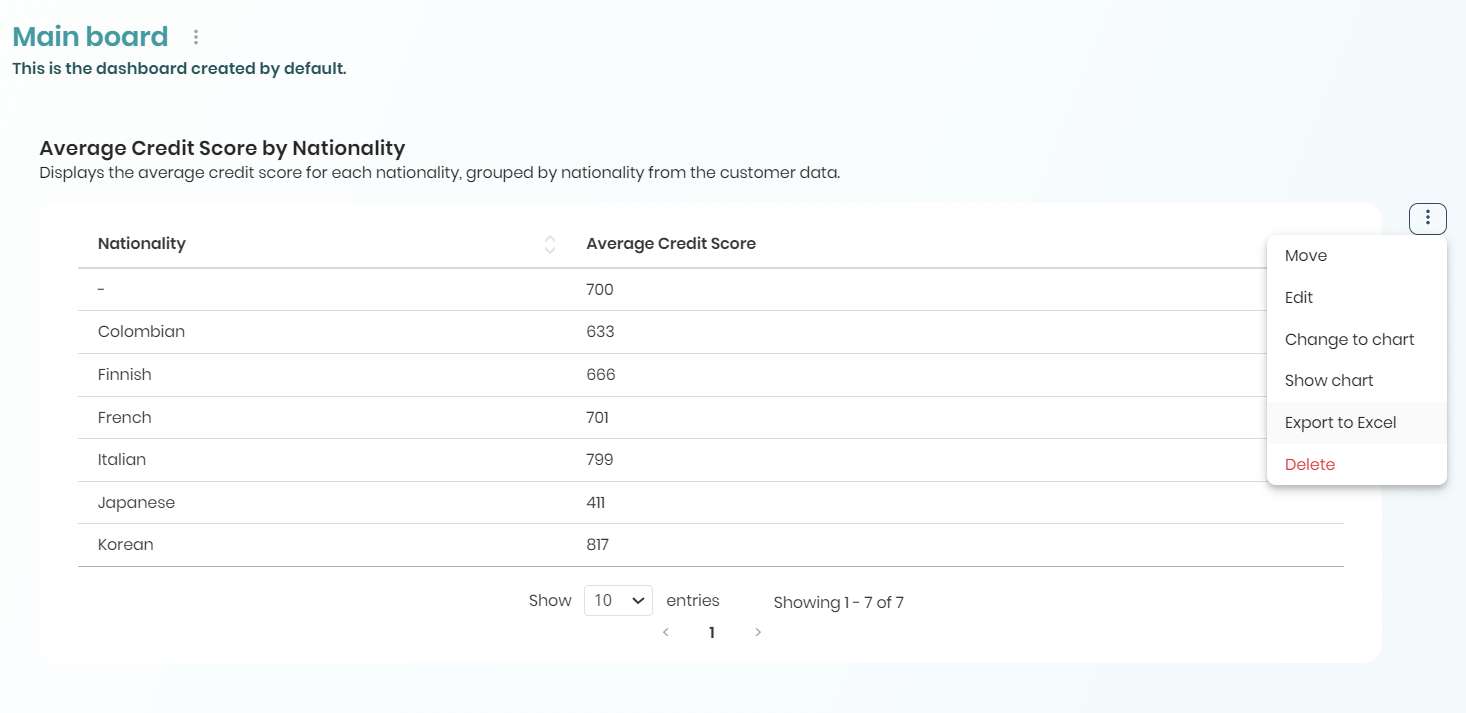
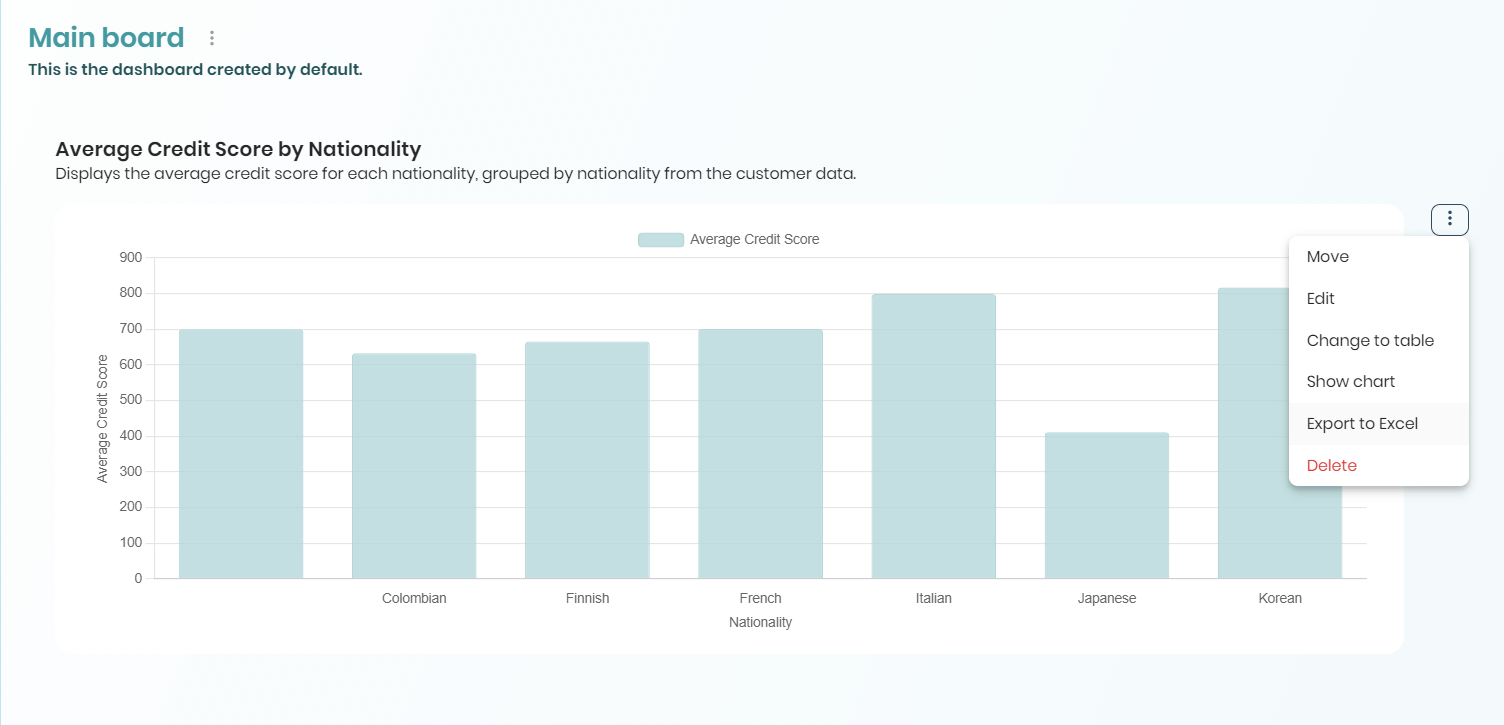
Move a result from one dashboard to another
To move a result from one board to another, click the three-dot menu located to the right of the result, and select the Move option.
This action opens the Move to another dashboard, where you must choose to which board to move the result. Once selected, click the Save changes button to finalize the change.
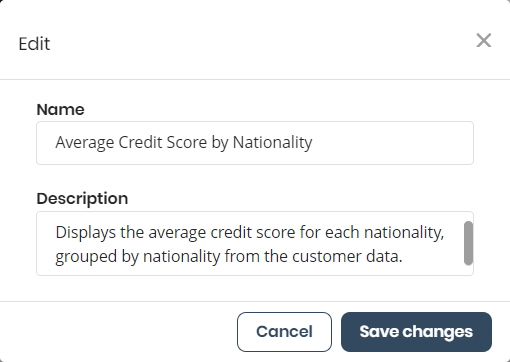
Edit a result
To edit the title or description of a result, click the three-dot menu located to the right of the result, and select the Edit option.
In the Edit window you can change the Name and Description of the result.
Delete a result
To delete a result, click the three-dot menu located to the right of the result, and select the Delete option.
Once the Delete response from dashboard window opens, confirm your decision by clicking the Yes, delete button.

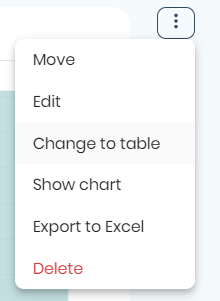
Change to chart/Change to table
This menu option allows you to change the display of a result between a table or chart format. To do this:
1.Click the three dot button on the upper right corner of your chart/table.
2.Select the Change to table/Change to chart option.
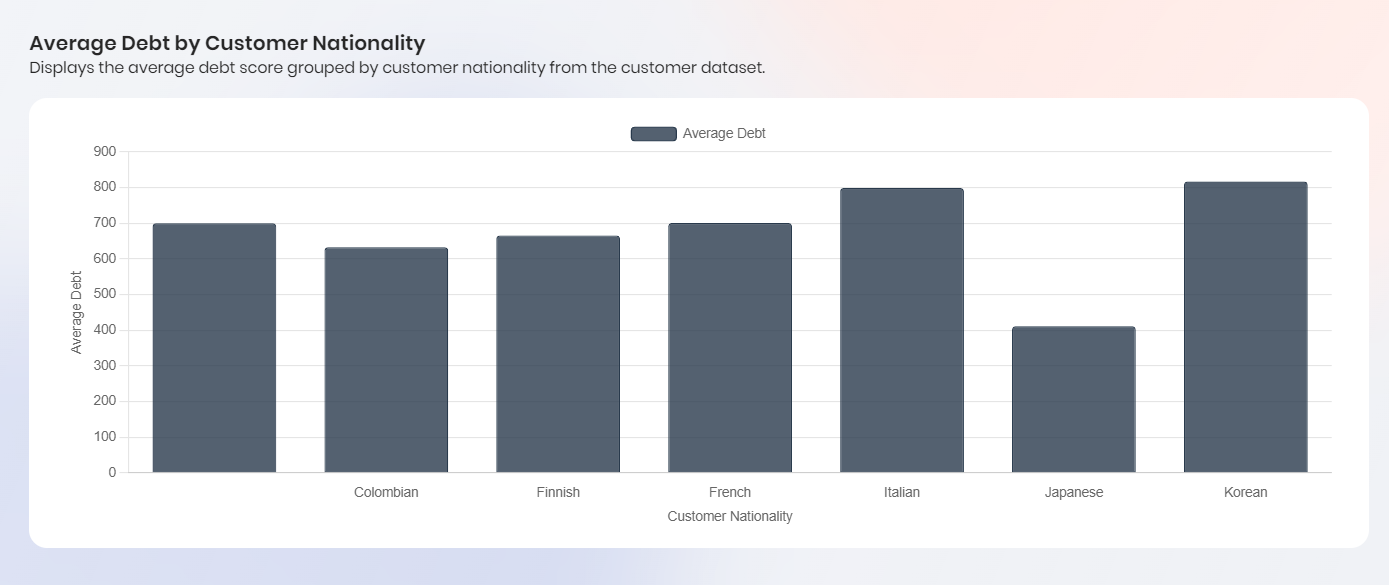
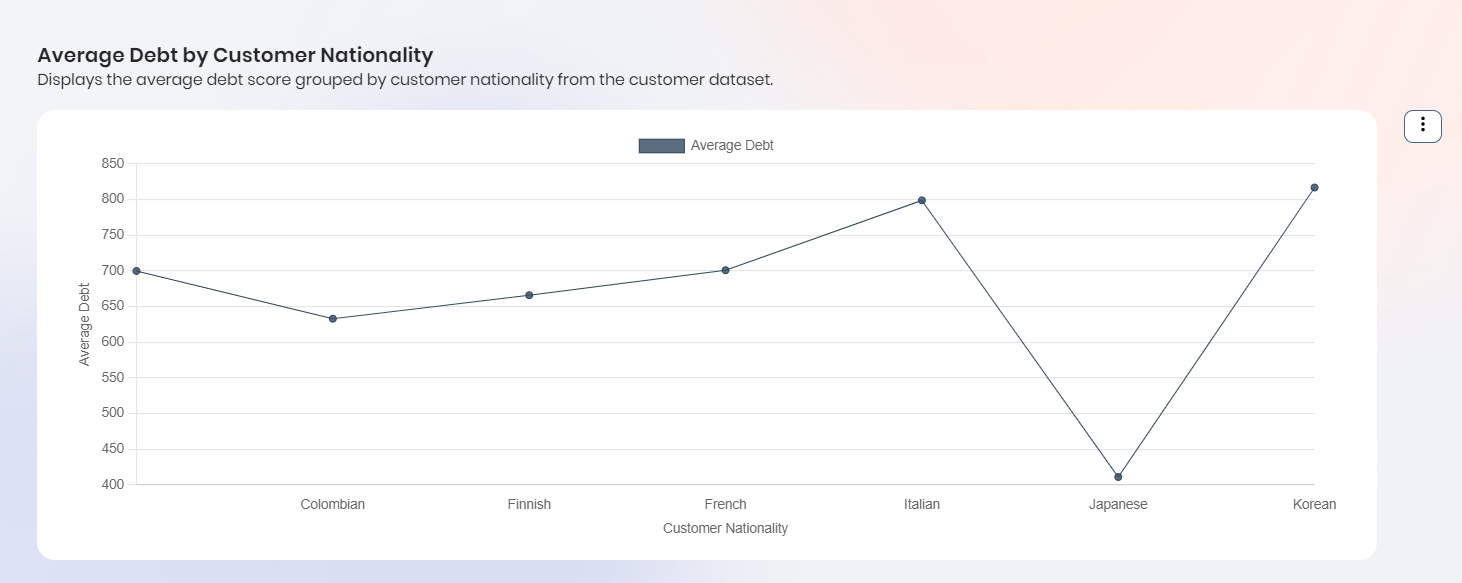
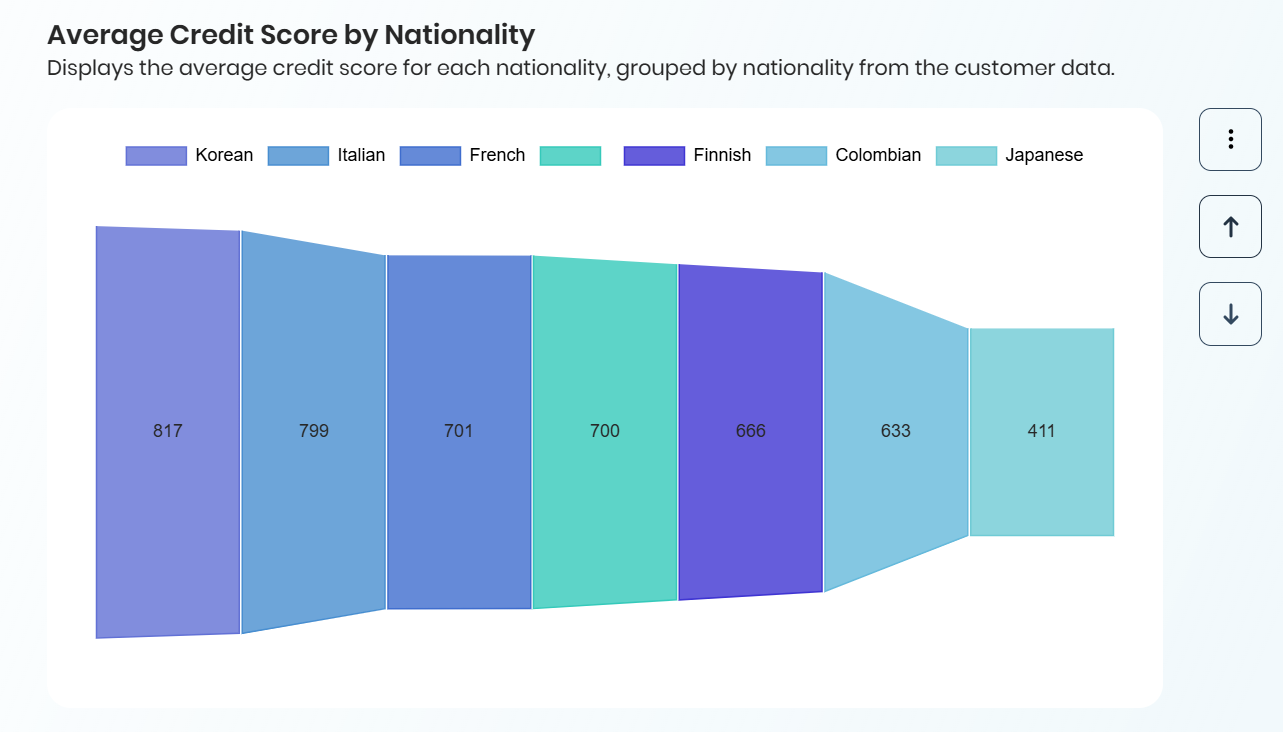
Change type of chart
You can change the chart type for each chart-based response. To do this:
1.Click the three dot button on the upper right corner of your chart/table.
2.Select the option Show chart.
3.Select the type of chart you wish to use.
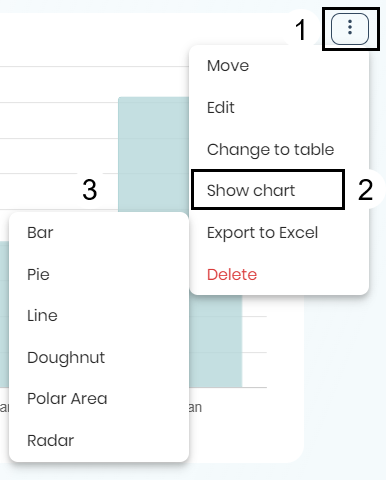
You can choose between the following types of charts:
•Bar
•Pie

•Line
•Doughnut

•Polar Area

•Radar

•Funnel
•Stacked Bar
|
Keep in mind that Stack Bar graphs is enabled only when the data shares a single common attribute. |
Pivot Query Conversion
Parametric tables can be used as pivots to generate better multi-series graphs. In grouping queries, the system detects opportunities to transform rows into columns using SQL Server’s PIVOT option, enhancing the precision of multi-series charts.
|
Keep in mind that the pivot option is only available in queries involving parametric entities. |
Export a result to an Excel file
To export the table or bar chart of a result to an Excel file from a dashboard, navigate to a result stored in the dashboard. Then, click the three-dot menu located to the right of the result, and select the Export to Excel option.
When you select a table result for export, it looks like this:
If you choose to export a bar chart result, it looks like this:
Once the export is done, you can open the file and explore the values.
|
Keep in mind that the exported Excel file can only include 1000 values. |
Last Updated 5/10/2025 4:24:26 PM