Overview
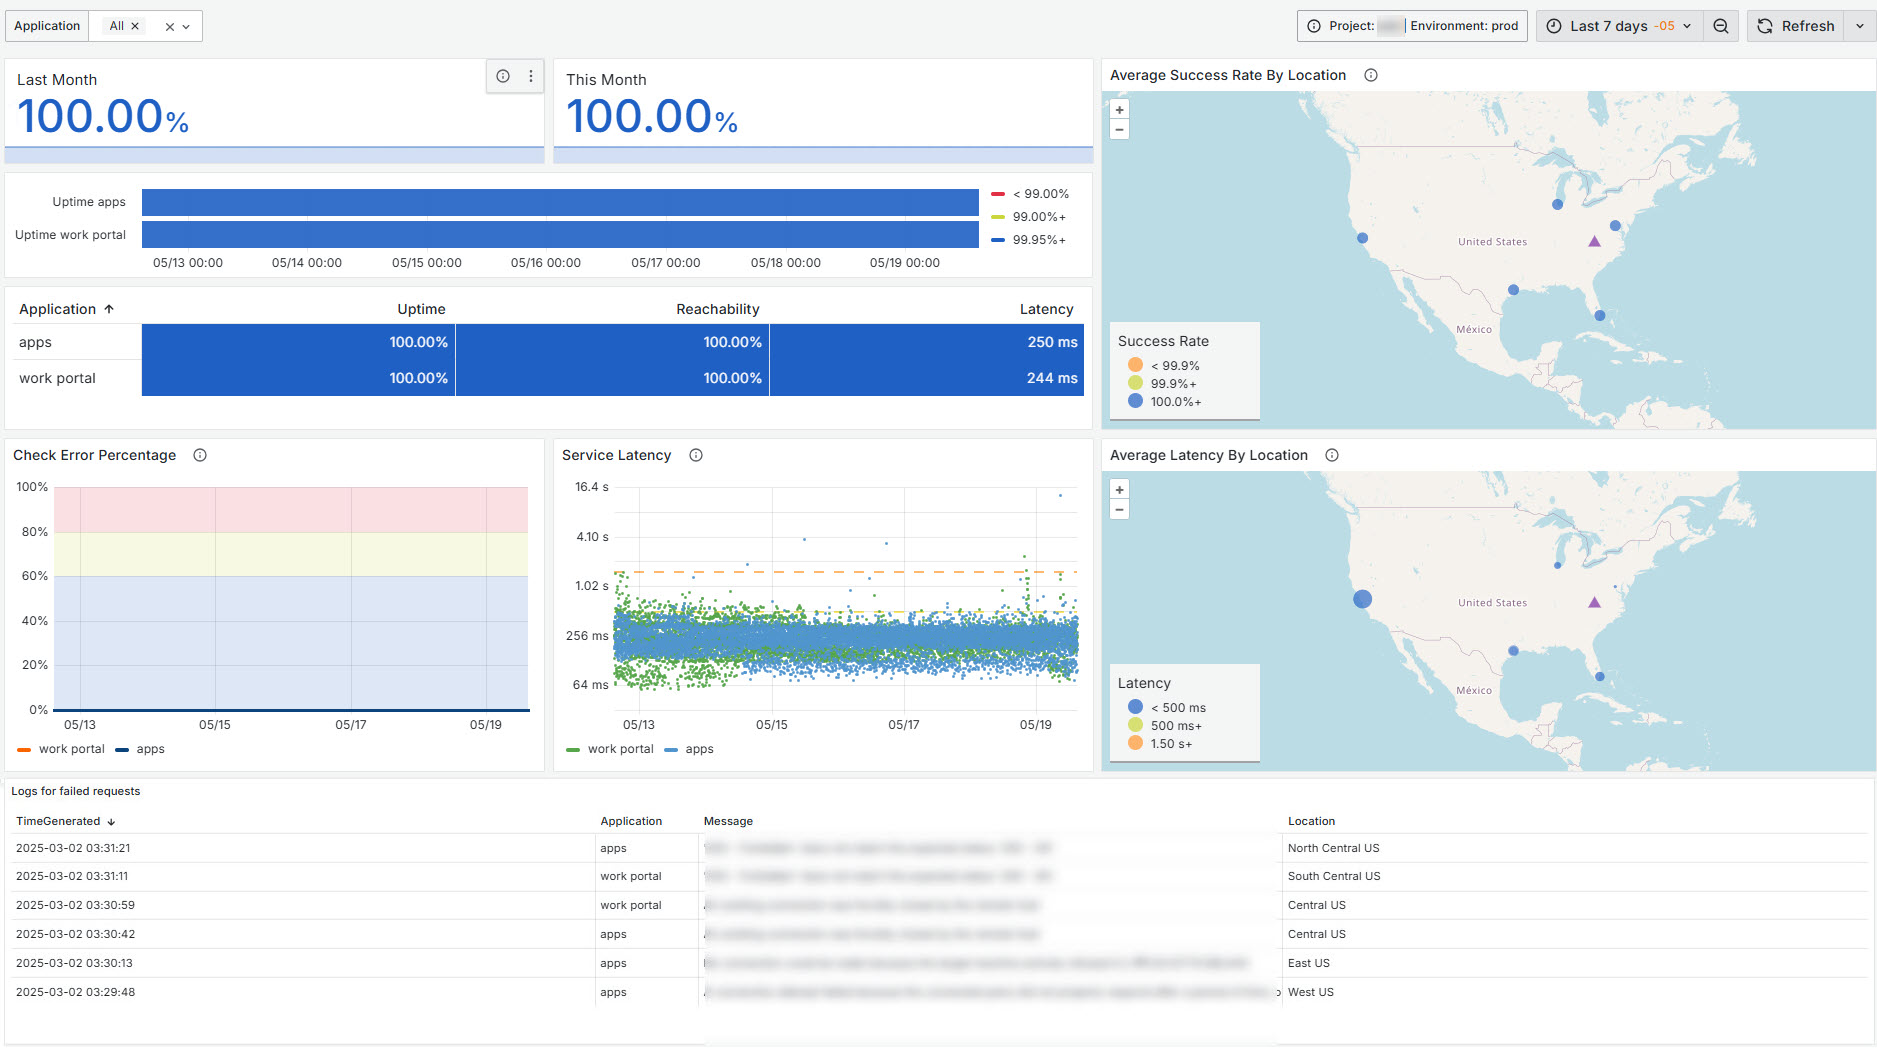
The Uptime Dashboard provides a detailed view of your environment’s uptime, latency, and reachability. It includes a breakdown of uptime for the two main components: Work Portal and Apps. Color-coded graphs display uptime trends over the selected period, helping you quickly assess system performance.
You can adjust the time range at the top of the dashboard to explore trends over different periods. When a new range is selected, the graphs automatically update to reflect the corresponding data.
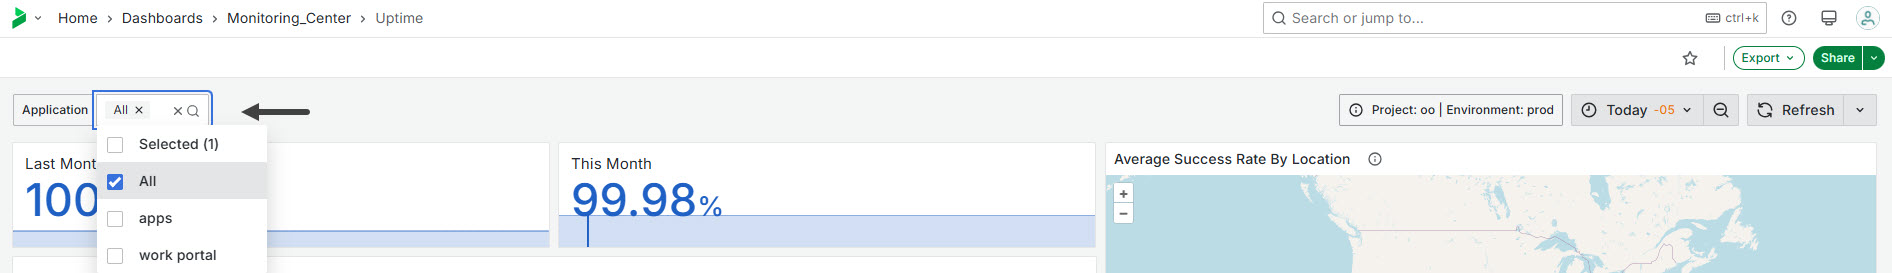
Component Selection
Choose to review one, two, or all components in detail using the widgets at the top. Select from: Work Portal, Apps or both.
Uptime, Reachability and Latency
The table showcases Uptime, Reachability and Latency together. The rows display the two main components: Work Portal and Apps, while the columns show their respective Uptime, Reachability and Latency percentages.
•Uptime is considered 100% when any of the five regions respond to the service check.
•Reachability decreases if any region fails to respond, with a 20% reduction for each unresponsive region over a five-minute period, as each region is pinged every minute.
•Latency refers to the time it takes for a request to travel from the user to the service and back. In other words, it's the delay before a transfer of data begins following an instruction. It uses a scatter graph to visualize latency over time.
Check Error Percentage
This graph displays the percentage of errors over time, helping you monitor the frequency of errors within the system. Errors can be filtered by component, with each component color-coded for easy identification.
By observing the error percentage trends and filtering by component, you can identify periods of instability or issues specific to each component, allowing for targeted investigation and resolution.
•The Y-Axis Represents the error percentage, starting from 0% (no errors) to 100% (all requests result in errors).
•The X-Axis shows a time line that adjusts based on the selected time range at the top.
Service Latency
Every minute the system calls a Health-check endpoint for Work Portal and Apps, which are the customer-facing services that better reflect the response time perceived.
•The x-axis shows the time, which auto-adjusts based on the selected time range at the top. Longer time ranges will display many more dots or events.
•The y-axis shows latency ranging from 64 ms to 16.4 seconds, with a dotted line at 1.2 seconds indicating a threshold. Ideally, latency should fall below this yellow dotted line, as it indicates quicker response times for end users.
Each component is color-coded.
Average success Rate by Location
This graph displays a map highlighting the uptime percentage success rate for the different regions. The uptime on the map is color-coded, for each region, based on its success rate, providing an intuitive overview of the service across various locations.
Average Latency by Location
This map provides a visual representation of latency across the five regions. Each region is color-coded to indicate the average latency: green for latency less than 500ms, yellow for latency between 500ms and 1.5 seconds, and red for latency greater than 1.5 seconds. This map helps users quickly identify regions with optimal performance, ensuring a better user experience globally.
Logs for failed requests
This widget displays a list of failed application requests, allowing you to monitor and troubleshoot errors within your applications. Errors may occur occasionally and are usually isolated incidents. If errors persist over time, you can verify the application's overall responsiveness using the Uptime graph. A decrease in Uptime indicates that the entire application is unresponsive. If Uptime remains stable but errors continue, it may suggest a localized issue affecting reachability.
The data is organized by the time the error occurred, application name, error message, and location.
Last Updated 11/19/2025 11:56:45 AM