Overview
This section provides real-time visibility into the availability and responsiveness of your Bizagi platform. It displays the uptime percentage of key components, such as the Work Portal and Apps, along with latency data to help assess overall system health. The data is collected through geographically distributed health checks, offering a comprehensive view of platform performance.
•Availability, both uptime and reachability, is monitored through responses from five regions, validated every minute. These are visually represented on a map, and when all regions are unavailable, Bizagi records a downtime. Uptime data is available for up to 90 days.
•Additionally, this section includes the Environment version, which shows the most recent release configured in the selected Environment, and last update, indicating the time elapsed since the last update was applied—both supporting quick identification of the selected environment's status and update history.
|
The Configuration Management button in the top panel of the Monitoring Center Home provides a centralized view of version history, changes, and updates applied your environments and related components, enabling traceability and configuration control across subscriptions. |
Home Uptime information
The following widgets are displayed in the Uptime pillar on the Monitoring Center Home. These graphs collectively provide a detailed view of the Environment's uptime.
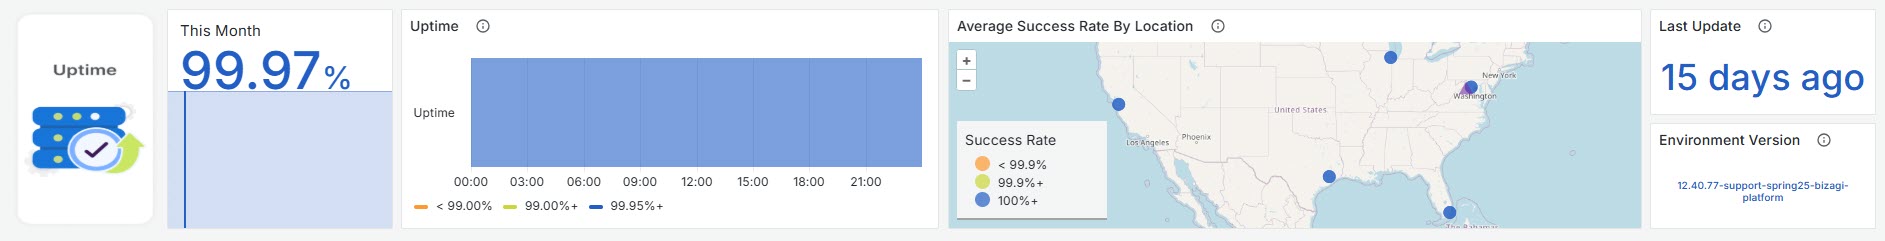
This Month Uptime
This widget presents a high-level view of the overall uptime percentage for the current month, for the whole Environment. It uses a graphical representation to show uptime trends and its percentages over time with color coded information to show the system's availability.
Uptime
This widgets tracks the uptime percentage of applications by analyzing availability results over time
Average Success Rate By Location
A geographic map visualizes the locations where monitoring checks are performed, displaying their response success rates. It uses application availability data mapped to specific coordinates to represent different regions. Success rates are averaged and categorized into performance thresholds, which are color-coded for quick interpretation. Each location is marked with a symbol, enabling easy visual comparison of system responsiveness across various geographic areas.
Environment Version
Displays the most recent release configured in the selected Environment, allowing for quick identification of the active version.
Last Update
Indicates the time elapsed since the last update was applied to the selected Environment, helping track how frequently and recently updates are performed.
Last Updated 11/19/2025 1:08:45 PM