Overview
The Bizagi Monitoring Center is a comprehensive portal designed to provide enhanced visibility into platform performance and process execution. Tailored for customers with Silver Support and above, this portal offers increased insight into service health, process metrics, and performance indicators, making it an essential tool for platform administrators and project owners.
Key features of the Monitoring Center include real-time uptime monitoring, process-level metrics, AI operation metrics, and the identification of long-running operations. These features help in identifying issues such as platform downtime, process bottlenecks, and inefficient application usage. Additionally, the Monitoring Center relies on the Customer Portal to manage user access permissions, ensuring controlled access management and system security.
•The Monitoring Center is crucial for ensuring the stability and reliability of automated processes in the Development environment. It allows teams to test the stability of various components, including jobs, rules, and Forms, among other features. By using the Monitoring Center, development teams can identify potential issues that might arise in production and address them before going live. This proactive approach helps in maintaining a smooth and efficient Production environment, minimizing downtime and ensuring high-quality performance.
•In the Test environment, the Monitoring Center is essential for validating and refining automated processes before they go live. It allows teams to simulate real-world scenarios and test the functionality of jobs, rules, Forms, and other features. By using the portal in the Test environment, teams can identify and resolve potential issues, ensuring that processes are stable and perform as expected. This thorough testing helps prevent disruptions and errors in the Production environment, leading to a smoother deployment.
•In the Production environment, once processes have been thoroughly tested and refined, the portal becomes a critical tool for monitoring and managing live operations. It provides real-time insights into the performance and health of automated processes, enabling teams to quickly detect and address any issues that arise. The portal's monitoring capabilities help maintain high levels of efficiency and reliability, ensuring that business operations run smoothly and without interruption. By continuously monitoring the Production environment, teams can proactively manage performance and make data-driven decisions to optimize processes.
The Monitoring Center is powered by Grafana, utilizing data sourced from Prometheus and Azure's Log Analytics. All information logged to build these dashboards remains securely within the boundaries of your subscription and never leaves your Azure environment.
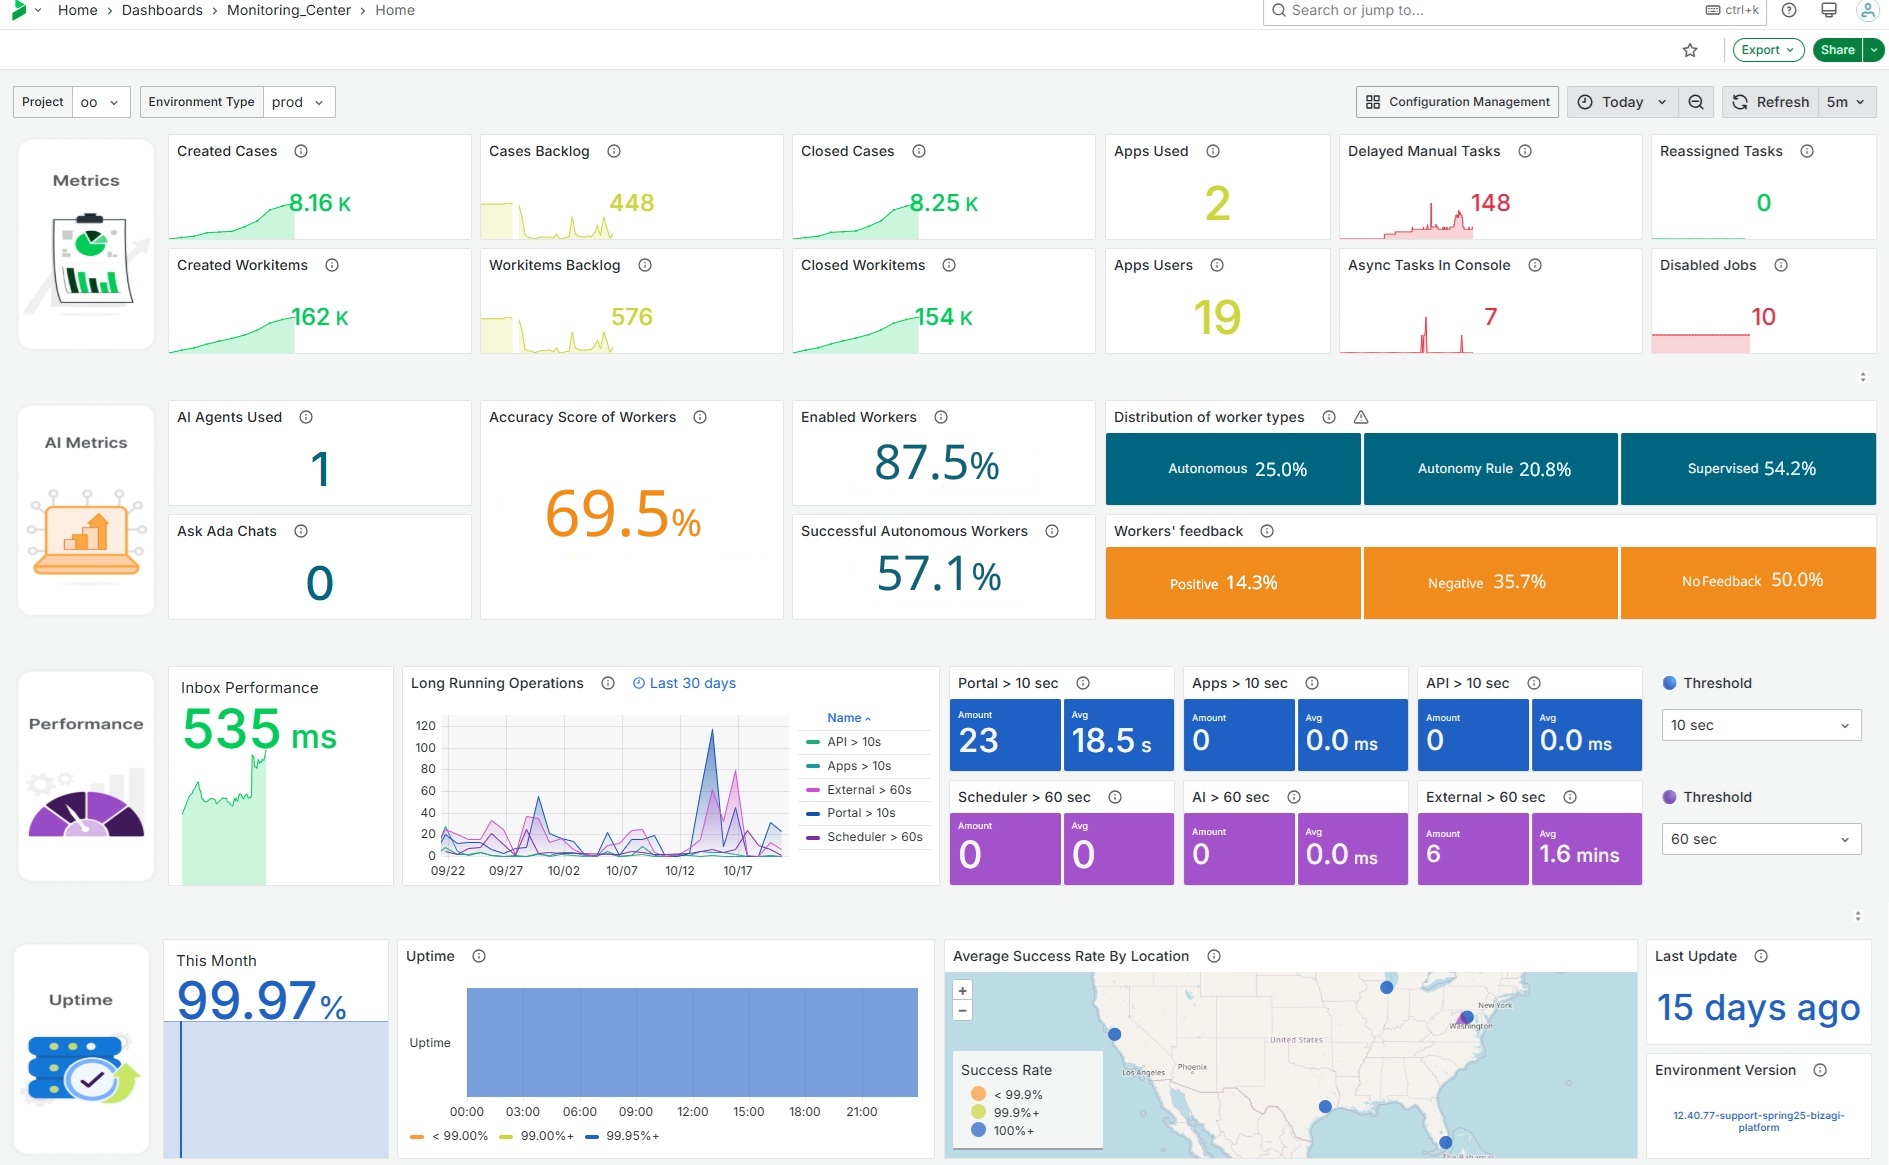
The Monitoring Center is organized into four pillars in its Home. All pillars effectively retain valuable information from the past 30 days, and some panels offer the added advantage of displaying data from even earlier periods, for more information check the Metrics Trends and Forecasts documentation. Click any of the icons on the left of these four pillars to navigate to a detailed dashboard for each category.
1.Metrics: This section provides at-a-glance metrics on case creation/closure, Workitem execution, Apps usage, delayed, disabled and pending tasks. It includes trend analysis to show usage over time. Metrics display information up to 18 months back in time.
2.AI Metrics: This section provides an overview of AI-related activity, including usage statistics for AI Agents, Ask Ada, and AI Workers. It tracks effectiveness through user interactions—such as accepted or modified Form fields—and collects feedback ratings. Additionally, it shows how AI Workers are distributed and implemented across tasks, segmented by type (Autonomous, Execution Rule, and Supervised).
3.Performance: The Performance dashboards provide insights into system efficiency by displaying metrics like time taken for tasks, moving averages, and the frequency of specific events. Users can monitor trends, identify performance bottlenecks, and ensure optimal operation across various system components. Performance can display information up to 90 days back in time.
4.Uptime: The dashboard provides an overview of the Bizagi PaaS environment's uptime over the past 30 days. Availability is assessed by monitoring responses from various regions, visually represented on the map. These responses are validated every minute switching between regions. When all regions are unavailable, Bizagi records a downtime. Uptime displays information up to 90 days back in time. This section also displays the platform's current environment version and when it was last updated.
The Monitoring Center is accessed directly through a defined URL for each Bizagi PaaS project or via a link in the Customer Portal.
https://monitoringcenter-[CompanyName].bizagi.com/
To view environment-specific information, select the desired environment from the dropdown menu at the top of the Monitoring Center portal screen.
With its metrics and visual dashboards, the Monitoring Center facilitates informed decision-making and optimizes business supervision and system status.
In the following articles, you can find information related to user administration and the content of the Monitoring Center.
Last Updated 7/21/2026 12:20:02 PM