Overview
The Performance section of the Bizagi Monitoring Center helps identify and analyze long-running operations within your processes, enabling early detection of bottlenecks and performance issues. This supports faster resolution and improved process efficiency. Operations that exceed predefined thresholds are highlighted, along with their average execution times, allowing for deeper investigation.
Beyond long-running operations, the section also displays average processing times for various platform activities, offering a broader view of system behavior. Keep in mind that execution times may vary significantly depending on the complexity of each operation.
Home Performance Information
The following widgets are displayed in the Performance pillar on the Monitoring Center Home. These graphs collectively provide a detailed view of the Environment's performance detailing long running operations in various components of the system.
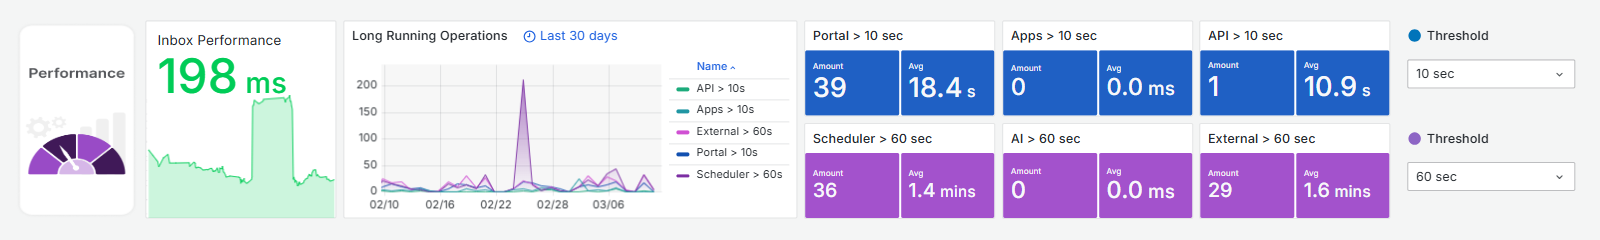
Thresholds
On the right you will find two color-coded Threshold values.
The top Threshold sets the time for the Portal, Apps and API long running operations.
The bottom Threshold sets the time for Scheduler, AI and External operations.
When choosing the thresholds, the widgets will display the number of long running operations that surpass given time as well as their average in milliseconds (except the Inbox performance that is not affected by the chosen thresholds).
Inbox Performance
This graph helps you understand how quickly the system is processing your Inbox-related tasks.
It shows the moving average over the last 20 data points. A moving average helps smooth out short-term fluctuations and highlights longer-term trends, making it easier to see how performance is changing over time.
Inbox performance is calculated using the 95th percentile (P95) of time taken for all specific calls, aggregated in 5-minute intervals. By using the 95th percentile, Bizagi focuses on the performance of the majority calls while ignoring the extreme outliers that might skew the data. This helps to provide a more accurate representation of typical performance.
The thresholds are set with colors: green for values below 5000 ms, yellow for values between 5000 ms and 10000 ms, and orange for values above 10000 ms.
If you notice the graph frequently showing yellow or orange, it might indicate performance issues that could affect your productivity.
Long-Running Operations
This widget displays the count of operations that exceed the specified duration threshold over the last 30 days, given the chosen thresholds.
It includes data for the different services such as Portal, API, Scheduler, External services, Apps, and AI operations. The metric tracks the number of occurrences where each type surpasses its defined threshold in seconds and provides a trend analysis to identify patterns over time.
Portal, Apps and API
These widgets provide a summary of SYNCHRONOUS operations (started by an end user or a system, waiting for a response after an action), that exceed the specified top threshold value on the right. It calculates and displays metrics such as the number of operations that have exceeded the threshold and out of those, it calculates their average duration (Avg) in milliseconds.
•Portal: It displays events related to Bizagi operations: Save, Next and Form rendering (the time it takes for Bizagi's engine to build and send the information to be displayed to the end user in a Form).
•Apps: This widget shows the number of operations launched by an end user executed in Bizagi Apps, that exceed the specific duration threshold.
•API: It displays the invocations to Bizagi that are associated with OData requests and requests via the SOA layer.
Scheduler, AI and External
These widgets provide a summary ASYNCHRONOUS operations that exceed the specified threshold value on the right. It calculates and displays metrics such as the number of operations that have exceeded the threshold and out of those, it calculates their average duration (Avg) in milliseconds.
Complex asynchronous operations usually take longer than synchronous operations, thus colors and thresholds are separate. Your implementation and the complexity of your operations may display high times, that can be considered as normal. It is important to review through time what is the standard duration of your operations so you can identify which spikes are controlled and when you need to review in depth.
•Scheduler: It displays event related to asynchronous tasks, Custom jobs, Timer Events and system jobs.
•AI: The metric is calculated by filtering events related to AI: each AI Agents call and each Ask Ada question, measuring their durations.
•External: It display events related to Connectors and web services executions. It does not include external system calls executed from Component Libraries.
Last Updated 11/19/2025 11:15:38 AM