Overview
This article provides a comprehensive guide to understanding various performance metrics and widgets in the Bizagi Monitoring Center. It explains how different widgets, such as Time Taken | Percentile 95, Time Taken | MA20, and Occurrences, help users monitor and analyze the performance of their Inbox and other system components. The article also covers Long Running Operations and their associated thresholds, detailing how these metrics can identify potential performance bottlenecks in different areas like Portal, Apps, API, Scheduler, AI, and External services. By understanding these metrics, you can gain insights into system performance, identify areas for improvement, and ensure efficient operation within the Bizagi environment.
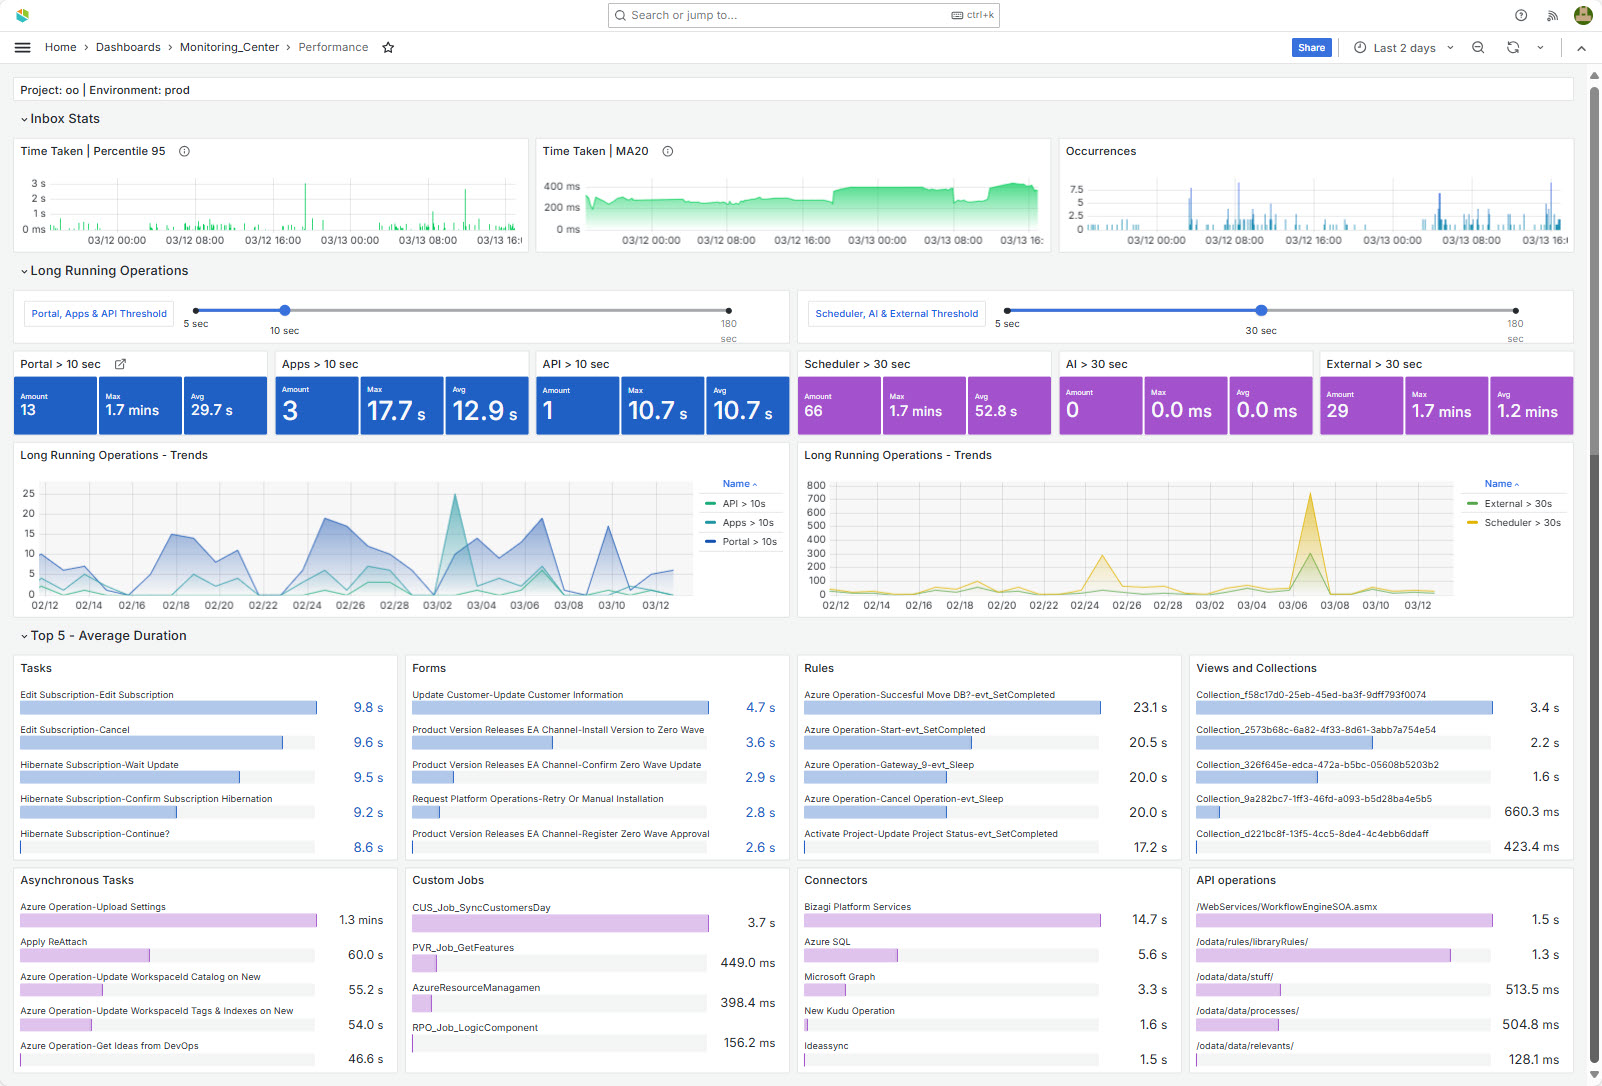
Inbox Stats
Time Taken | Percentile 95
This widget measures the time it takes to process tasks in your Inbox. It aggregates data of interactions of the Inbox every five minutes, adding up all the occurrences within each interval.
Percentile P95 indicates that 95% of the data points are less than or equal to this value. This helps you understand the performance for the majority of cases, focusing on typical behavior rather than extreme outliers.
Time Taken | MA20
This graph shows the moving average over the last 20 data points, aggregating interactions of the Inbox every five minutes. A moving average is a statistical method used to smooth out short-term fluctuations in data and highlight longer-term trends. By averaging the last 20 data points, the moving average helps to reduce the impact of sudden spikes or drops in the data. This makes it easier to see the overall trend without being distracted by short-term variations.
Occurrences
This widget shows the times that the Inbox is opened every five minutes. Each bar represents the number of times the Inbox was opened during that 5-minute period. If there are gaps, it means no one opened the Inbox during those times. The widget focuses on the total number of events, without using complex statistical measures, making it easy to see overall activity within a given period.
Long Running Operations
Thresholds
On the middle of the page you will find two color-coded Threshold sliders. The left Threshold sets the time for the synchronous services: Portal, Apps and API long running operations. The left Threshold sets the time for asynchronous activities: Scheduler, AI and External operations. When choosing the thresholds, the widgets below will display the number of long running operations that surpass the given time, the maximum time taken for those counted as well as their average in seconds.
Portal
This widget displays the number of operations that exceed the specified duration threshold for portal activities. The metric is calculated by filtering events related to specific Bizagi operations: 'Save', 'Next' and Form rendering (the time it takes for Engine to send the information to be displayed to the end user in the form), measuring their duration. If the duration surpasses the set threshold, it counts as an operation above the threshold. The widget provides insights into how often portal-related tasks take longer than expected, helping you to identify potential performance bottlenecks in portal interactions.
Apps
This widget shows the number of Bizagi Apps operations that exceed the specific duration threshold. The metric is determined by filtering events related to App activities and calculating their durations. If the operation's duration surpasses the given threshold, it counts as an operation above the threshold. This information helps you to monitor and identify potential performance issues.
API
This widget indicates the number of API operations that exceed the specified duration threshold. It displays the invocations to Bizagi that are associated with OData requests and requests via the SOA layer. If an operation's duration surpasses the set threshold, it counts as an operation above the threshold. This helps users monitor potential performance issues in API processes, facilitating timely intervention to ensure optimal system performance.
Scheduler
This widget displays the number of scheduler operations that exceed the specified duration threshold. The metric is determined by filtering events related to scheduler activities and evaluating their durations (asynchronous tasks, Custom jobs, Timer Events and system jobs.). If an operation's duration surpasses the defined threshold, it counts as an operation above the threshold. This assists you in monitoring and identifying potential performance issues in scheduled tasks, ensuring efficient scheduling processes within the system.
AI
This widget presents the number of AI operations that exceed a specified duration threshold. The metric is calculated by filtering events related to AI: each AI Agents call and each Ask Ada question, measuring their durations. If an operation's duration surpasses the defined threshold, it counts as an operation above the threshold. This aids users in monitoring potential performance issues within AI processes, facilitating timely interventions to maintain efficient system performance
External
This widget displays the number of external operations that exceed a specified duration threshold. It display events related to Connectors and web services executions. It does not include external system calls executed from Component Libraries If an operation's duration surpasses the defined threshold, it counts as an operation above the threshold. This helps you monitor potential performance issues in external interactions, ensuring seamless integration with external systems and maintaining overall system efficiency.
Long Running Operations - Trends
This widget tracks and displays trends in long-running operations across various components, such as Portal, API, Scheduler, External services, Apps, and AI. It measures the number of operations that exceed the specified duration threshold over time. By analyzing this data, you can identify patterns and trends in performance issues across different parts of the system. This allows for proactive management and optimization to ensure efficient operation and performance stability within the Bizagi environment.
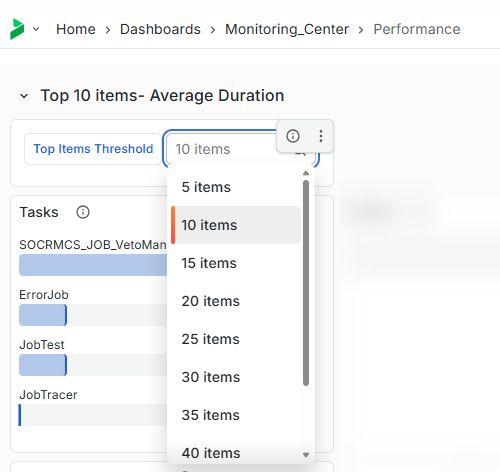
Top items - Average duration
The Top items - Average duration section in the Bizagi Monitoring Center highlights the most time-consuming components in your system, without considering thresholds. You can adjust how many items are displayed, from the top 5 up to the top 40, depending on the level of detail you need.
Each graph is automatically scaled to the most appropriate time unit—milliseconds, seconds, or minutes—based on the durations within its category. This allows you to quickly understand performance patterns at a glance.
By focusing on the longest-running components across different categories, this section helps you identify performance bottlenecks and prioritize optimization efforts.
Most graphs display first the name of the element and then the related process, making it easier to identify and locate the resources involved.
•Tasks: These refer to activities executed from the Work Portal, initiated by an end user. Tasks are triggered by actions such as clicking Next or Save and do not include scheduler activities. The Task duration considers the transaction from the moment the end user clicks "Next" until the next manual activity or event is opened, or if the case is closed. The Save action is also considered, from the moment the end user clicks Save until the Form is reloaded again.
•Forms: Measure the time taken to render a form. This duration is calculated from the moment the backend (or Bizagi's engine) sends the information to display to the end user. The metrics include forms associated with manual activities and events, including their global forms. Query forms are not considered in this measurement.
•Rules: This graph illustrates the average execution times of rules within Bizagi, encompassing both boolean and scripting expressions. It calculates the average duration each rule takes to execute, providing insight into the performance of rules execution. By displaying this data, the graph helps you identify which rules are consuming the most time, enabling you to focus on optimizing them to enhance overall system performance.
•Views and Collections: This widget presents the average loading times, for views and collections within Bizagi Apps. It displays how long it takes to load these elements, helping you identify any slow-performing views or collections that might impact the user experience. By analyzing this data, you can focus on optimizing these components to improve the overall responsiveness and performance of your applications.
•Asynchronous tasks: This chart calculates and displays the average duration of asynchronous tasks or asynchronous subprocess. An asynchronous task encompasses the entire operation from start to finish, including all its components. For example, a single asynchronous task may involve executing multiple rules, calling web services, utilizing connectors, and other activities within one task. The measurement accounts for the total time taken until the transaction is fully completed and closed. By analyzing this data, you can identify which asynchronous tasks are consuming the most time, allowing you to focus on optimizing these processes to enhance overall system performance.
•Custom jobs: This widget displays the average execution times of custom jobs within Bizagi. Custom jobs are user-defined configured to perform specific operations tailored to your organization's needs. The metric calculates the average duration each custom job takes from initiation to completion. By monitoring these execution times, you can identify any custom jobs that may be taking longer than expected.
•Connectors: This widget displays the average duration, of operations involving Connectors within Bizagi. It calculates the average time taken for each connector request execution, tracking from the moment the operation starts until it is fully completed. By analyzing these execution times, you can identify which connector operations are taking the longest, allowing you to focus on optimizing them to enhance overall system performance
•API operations: This widget displays the average duration of Bizagi API operations. Bizagi API operations refer to actions executed through Bizagi's Application Programming Interface, allowing external applications and systems to interact programmatically with the Bizagi platform. The metric calculates the average time taken for each API operation from initiation to completion. By analyzing these execution times, you can identify which API operations are taking the longest, enabling you to focus on optimizing them to enhance system integration and overall performance.
Last Updated 6/4/2026 3:47:39 PM