Overview
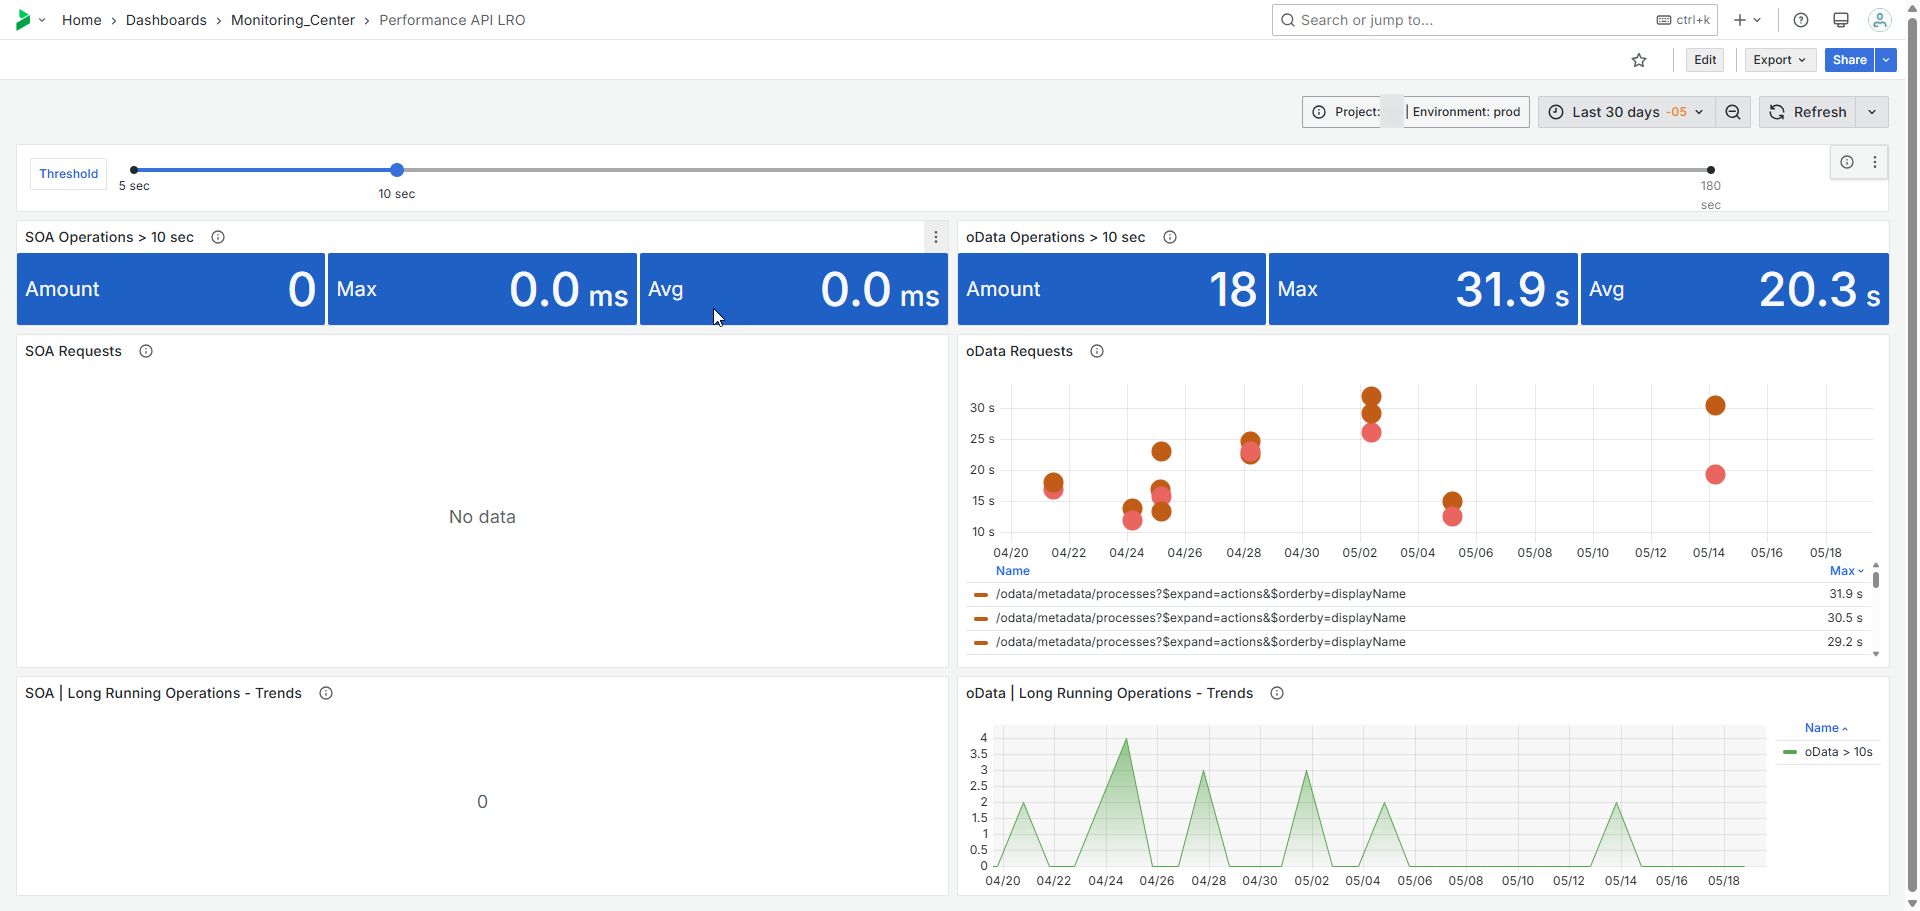
This dashboard helps monitor SOA and oData operations by highlighting the ones that exceed the predefined duration threshold. It displays key metrics such as operation counts, maximum and average durations, and provide detailed tables showing execution times across application, database, and external systems. Long-running operations are flagged, with durations in red indicating critical delays, allowing users to quickly identify and investigate performance issues.
To support proactive performance management, the SOA Long Running Operations - Trends and oData Long Running Operations - Trends widgets visualize how these delays evolve over time. By tracking the frequency of threshold breaches, users can detect recurring issues, assess system stability, and take corrective actions to maintain optimal performance within the Bizagi environment.
•SOA: Bizagi features an API for external applications to access the processes functionality and the business information underlying in your data model. Bizagi web services are already generated, built and published in order to speed up the implementation of integration requirements.
•oData: Bizagi provides programmatic access to the underlying business information in your data model, through a powerful API based on oData services.This API lets you work with your processes' data from external applications, such as information related to processes, cases, or experience-centric features.
•Thresholds: On the top of the page, you will find a Threshold slider that applies to all dashboards in the page. When choosing the threshold, the widgets below will display the number of long running operations that surpass the given time, the maximum time taken as well as their average in seconds.
SOA Operations > threshold
This widget displays the count and duration metrics for SOA Operations exceeding the specified threshold. It counts operations, calculates maximum durations and average durations.
Show detail
The widget provides a detailed table of operations executed for the SOA and oData transaction chosen, in chronological order. It identifies of all the events executed where the largest amount of time was needed to perform it. This way you can narrow down the identification of where an issue is being presented.
Only long running operations are displayed. You can choose to see all operations by changing the selection on the top to "All details". Keep an eye on the durations that are presented in red, which are the ones that hold the longer time.
The table contains the total duration on the top left, and it lists the duration of each subsequent operation separating between:
•App Duration: these are the operations run by Bizagi's Engine (executing a rule for example, in Work Portal or Scheduler)
•Database: these are operations executed directly in Bizagi's database
•External: these are operations that external systems take before responding an answer to Bizagi.
You can then identify out of the total duration, the operation that took longer.
When External systems are failing, at the end of the table you can review if the complete operation was successful or if it created a rollback (when receiving a timeout).
It lists various properties including start time, event type, task name, duration metrics, process name, operation details, error information, URL details among others. The duration values are highlighted based on thresholds indicating their performance status.
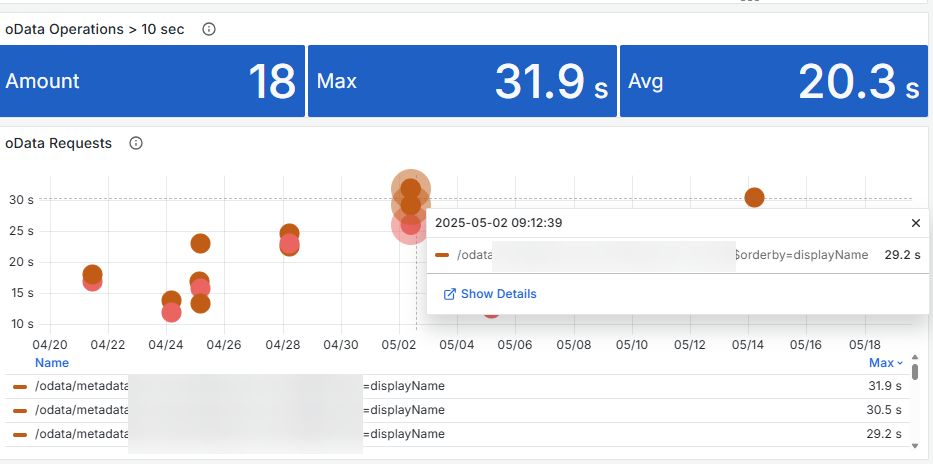
oData requests >threshold
The widget displays metrics related to oData requests that exceed a specified duration threshold, during the time frame chosen on the top. Thresholds are applied to highlight different performance levels with varying colors, indicating acceptable, warning, and critical statuses.
SOA Long Running Operations - Trends
This widget tracks and displays trends in SOA long-running operations. It measures the number of operations that exceed the specified duration threshold over time. By analyzing this data, you can identify patterns and trends over time in performance issues. This allows for proactive management and optimization to ensure efficient operation and performance stability within the Bizagi environment.
oData Long Running Operations - Trends
This widget tracks and displays trends in long-running operations for oData operations that exceed a specified duration threshold over time. It measures the number of operations exceeding this duration threshold, allowing users to identify patterns and trends related to performance issues. This analysis facilitates proactive management and optimization, ensuring efficient operation and performance stability within the Bizagi environment.
Last Updated 11/19/2025 11:37:09 AM