Overview
This dashboard empower customers by providing comprehensive insights into long-running operations for Forms and Tasks. It enables users to seamlessly link operational data with their projects, identify areas for process optimization, and detect errors for prompt corrective actions. It offers focused insights into performance bottlenecks, allowing for targeted improvements to maintain smooth operations. By leveraging this dashboard, users can make data-driven decisions to streamline processes, improve project outcomes, and ensure operational excellence.
Tasks: Refers to an activity executed from the Work Portal, initiated by an end user. Tasks are triggered by actions such as clicking Next or Save and do not include scheduler activities. The Task duration considers the transaction from the moment the end user clicks the Next button until the next manual activity or event is opened, or if the case is closed. The Save action is also considered, from the moment the end user clicks Save until the Form is reloaded again.
Forms: Measure the time taken to render a form. This duration is calculated from the moment the backend, Bizagi's engine, sends the information to display to the end user. The metrics include forms associated with manual activities and events, including their global forms. Query forms are not considered in this measurement.
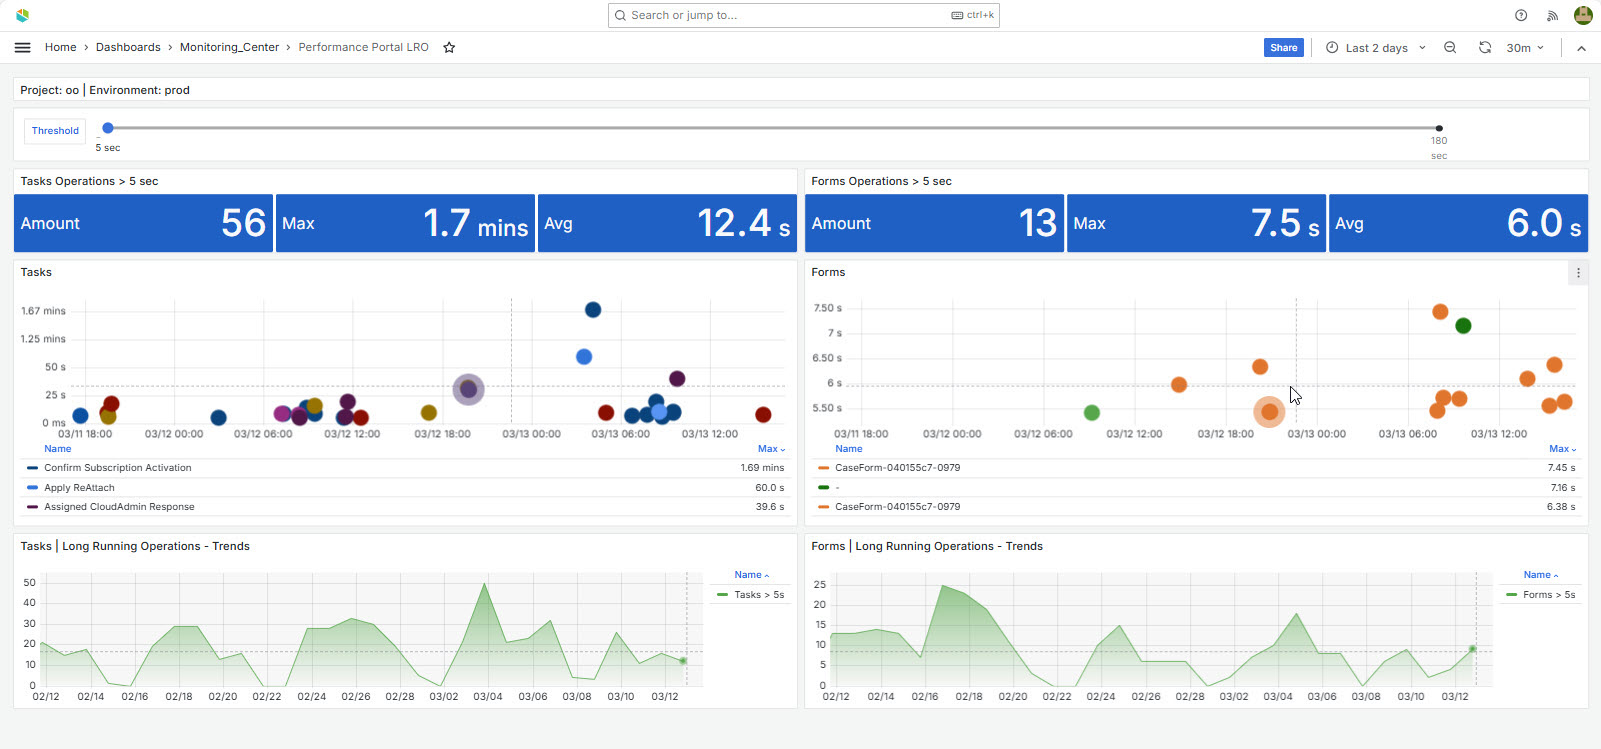
Thresholds: On the top of the page, you will find a Threshold slider that applies to all dashboards in the page. When choosing the threshold, the widgets below will display the number of long running operations that surpass the given time, the maximum time taken as well as their average in seconds.
Task Operations > threshold
The widget displays information on Task operations that exceed a specified threshold. It includes: The total count of task operations that have surpassed the threshold, the maximum duration which is the longest duration recorded for any task operation exceeding the threshold, and an average duration of all task operations that have exceeded the threshold.
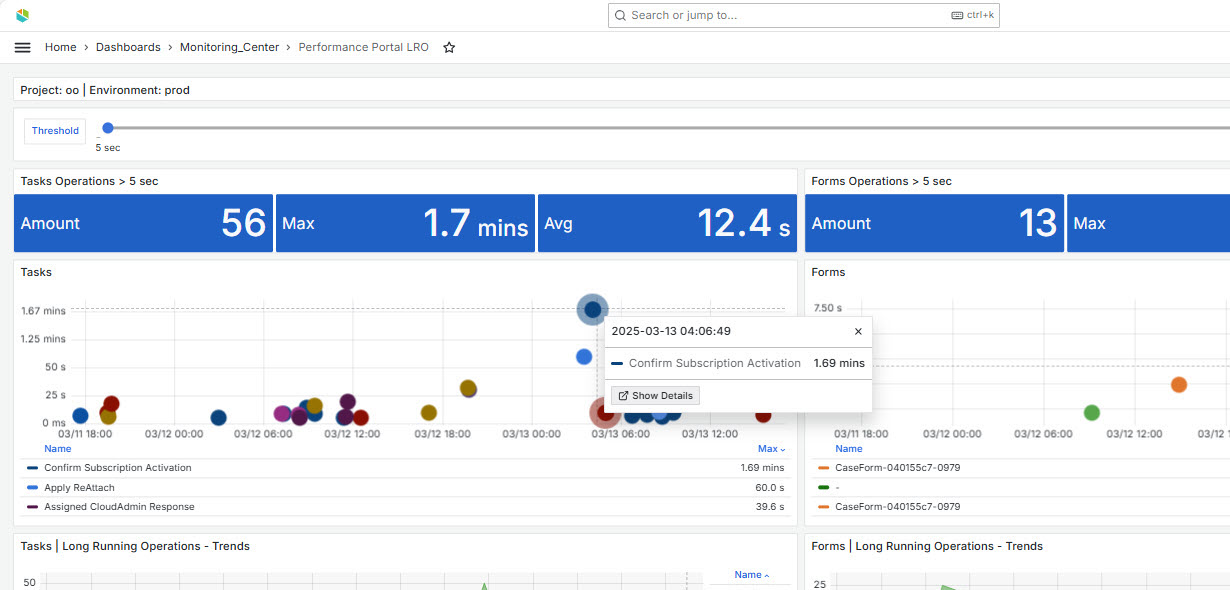
Tasks
This widget charts the in each "circle" independent tasks that surpass the defined threshold and displays them as points in time. Each point can be hovered to identify its name, its duration and when it happened. When clicking over the colored-dot an icon Show Details displays.
On the bottom of the widget a table lists all long running Tasks that fall under the time frame and threshold conditions, listing its duration.
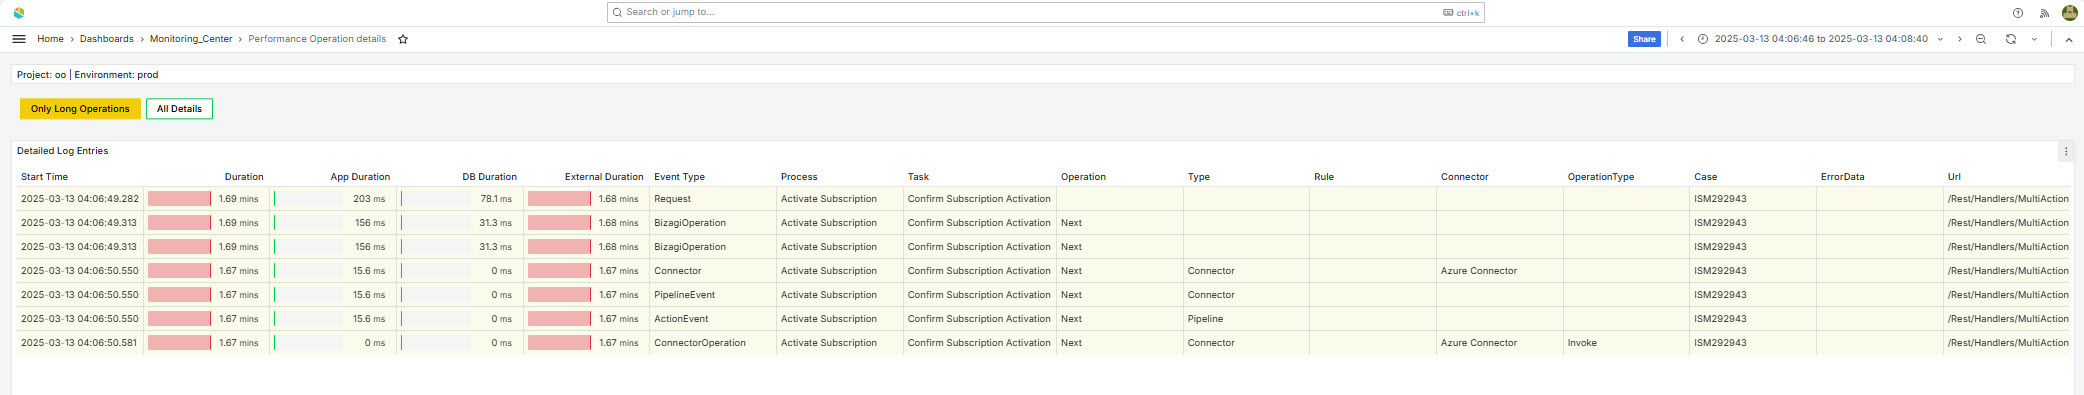
Show detail
The widget provides a detailed table of operations executed for the Task's transaction chosen, in chronological order. It identifies of all the events executed to perform such Task, where the largest amount of time was needed to perform it. This way you can narrow down the identification of where an issue is being presented.
Only long running operations are displayed. You can choose to see all operations by changing the selection on the top to "All details". Keep an eye on the durations that are presented in red, which are the ones that hold the longer time.
The table contains the total duration on the top left, and it lists the duration of each subsequent operation separating between:
•App Duration: these are the operations run by Bizagi's Engine (executing a rule for example, in Work Portal or Scheduler)
•Database: these are operations executed directly in Bizagi's database
•External: these are operations that external systems take before responding an answer to Bizagi.
You can then identify out of the total duration, the operation that took longer.
When External systems are failing, at the end of the table you can review if the complete operation was successful or if it created a rollback (when receiving a timeout).
It lists various properties including start time, event type, task name, duration metrics, process name, operation details, error information, URL details among others. The duration values are highlighted based on thresholds indicating their performance status.
Forms Operations >threshold
The widget displays metrics related to Form rendering operations that exceed a specified duration threshold, during the time frame chosen on the top. Thresholds are applied to highlight different performance levels with varying colors, indicating acceptable, warning, and critical statuses.
Forms
This widget charts the Forms that surpass the defined threshold and displays them as a time series using points in time. Each point can be hovered to identify its name and its duration. When clicking over the colored-dot an icon Show Details displays.
On the bottom of the widget a table lists all Forms that fall under the conditions, listing its duration.
Task Long Running Operations - Trends
This widget tracks and displays trends in Tasks long-running operations. It measures the number of Tasks that exceed the specified duration threshold over time. By analyzing this data, you can identify patterns and trends over time in performance issues. This allows for proactive management and optimization to ensure efficient operation and performance stability within the Bizagi environment.
Forms Long Running Operations - Trends
This widget tracks and displays trends in Forms long-running operations. It measures the number of Forms that exceed the specified duration threshold over time. By analyzing this data, you can identify patterns and trends over time in performance issues. This allows for proactive management and optimization to ensure efficient operation and performance stability within the Bizagi environment.
Last Updated 11/19/2025 12:58:17 PM