Overview
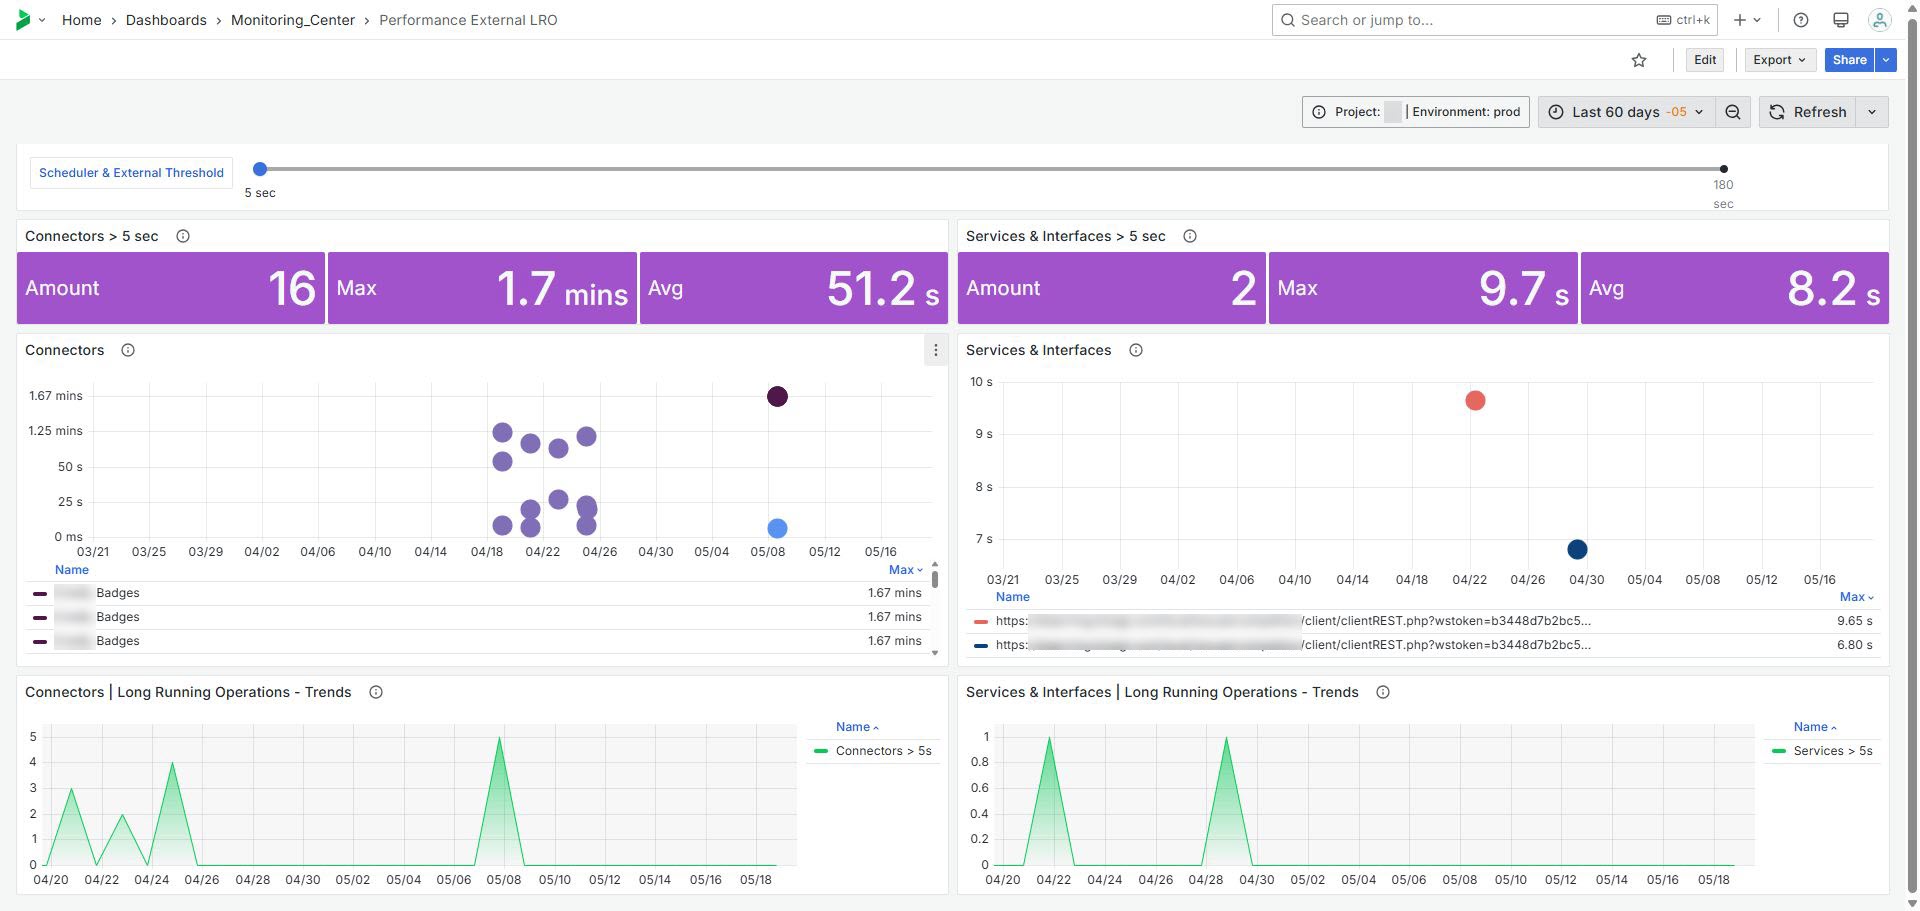
The Monitoring Center presents an analysis of long-running operations for Connectors, Services, and Interfaces, offering key performance metrics such as the count, maximum, and average durations of operations. A detailed view allows users to drill down into individual transactions to better understand execution times and potential bottlenecks.
Similarly, the widgets for Services and Interfaces highlight performance issues based on predefined thresholds, using color-coded indicators to reflect acceptable, warning, or critical levels. Trend widgets for both Connectors and Services track the frequency of long-running operations over time, enabling users to identify patterns and proactively address recurring issues. Together, these tools support effective performance monitoring and optimization, helping ensure system stability and efficiency within the Bizagi environment.
•Connectors: A Bizagi connector provides a group of actions available for any process to perform in another application. Through Bizagi connectors you may easily approach B2B integration scenarios, and rely on powerful features to connect to other systems and applications, especially to those using a modern architecture (i.e, typically those providing cloud services through a RESTful API).
•Services and Interfaces: For modern and service-oriented applications, Bizagi features integration capabilities that are easily configured to consume SOAP Web services or REST services (i.e, WCF services, RESTful APIs, any SOAP service available through the ESB, on-premise, or available at the cloud), in an asynchronous or synchronous fashion.
•Thresholds: On the top of the page, you will find a Threshold slider that applies to all dashboards in the page. When choosing the threshold, the widgets below will display the number of long running operations that surpass the given time, the maximum time taken as well as their average in seconds.
Connectors > threshold
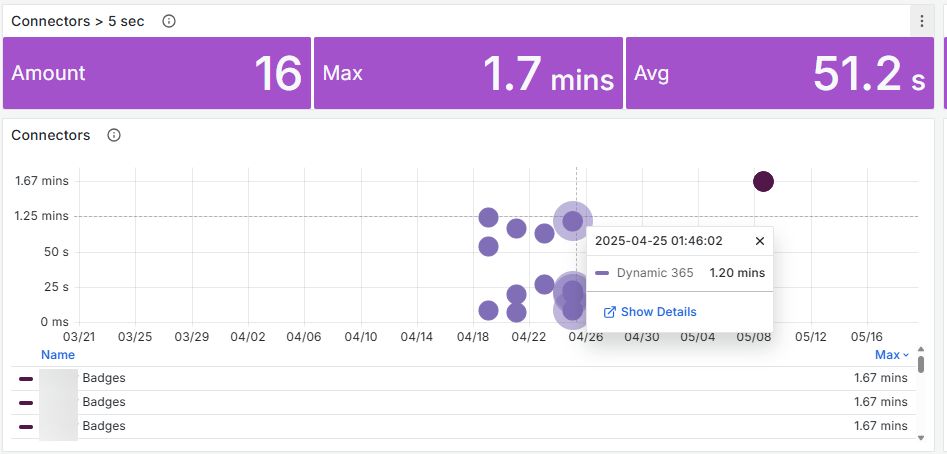
This widget displays the count and duration metrics for Connectors exceeding the specified threshold. It counts operations, calculates maximum durations and average durations.
Show detail
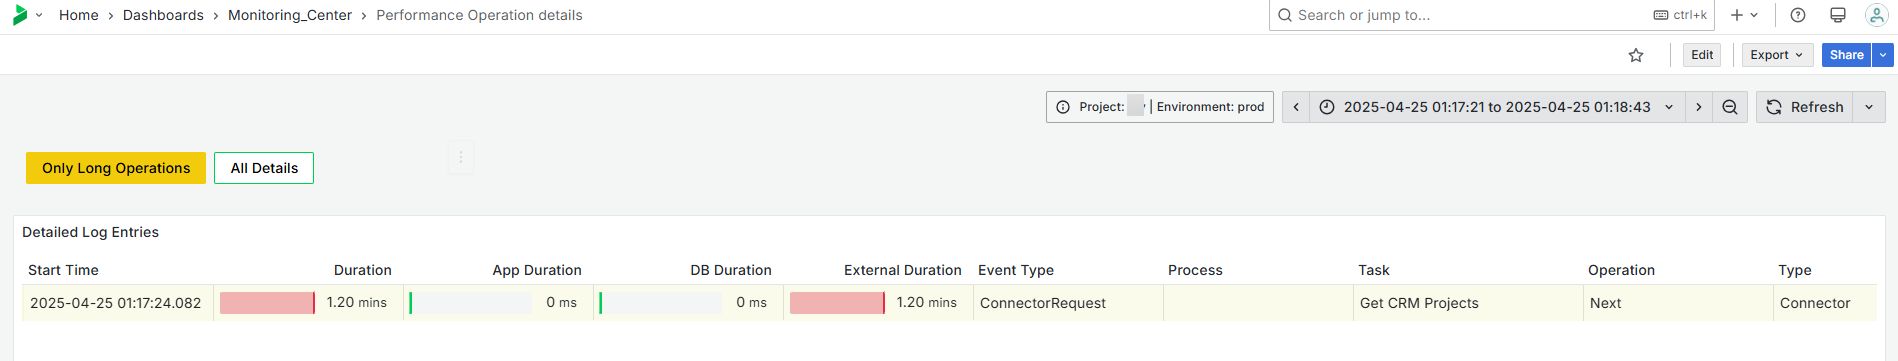
The widget provides a detailed table of operations executed for the Connector's transaction chosen, in chronological order. It identifies of all the events executed where the largest amount of time was needed to perform it. This way you can narrow down the identification of where an issue is being presented.
Only long running operations are displayed. You can choose to see all operations by changing the selection on the top to "All details". Keep an eye on the durations that are presented in red, which are the ones that hold the longer time.
The table contains the total duration on the top left, and it lists the duration of each subsequent operation separating between:
•App Duration: these are the operations run by Bizagi's Engine (executing a rule for example, in Work Portal or Scheduler)
•Database: these are operations executed directly in Bizagi's database
•External: these are operations that external systems take before responding an answer to Bizagi.
You can then identify out of the total duration, the operation that took longer.
When External systems are failing, at the end of the table you can review if the complete operation was successful or if it created a rollback (when receiving a timeout).
It lists various properties including start time, event type, task name, duration metrics, process name, operation details, error information, URL details among others. The duration values are highlighted based on thresholds indicating their performance status.
Services and Interfaces >threshold
The widget displays metrics related to Services and Interfaces that exceed a specified duration threshold, during the time frame chosen on the top. Thresholds are applied to highlight different performance levels with varying colors, indicating acceptable, warning, and critical statuses.
Connectors Long Running Operations - Trends
This widget tracks and displays trends in Connectors long-running operations. It measures the number of Connectors that exceed the specified duration threshold over time. By analyzing this data, you can identify patterns and trends over time in performance issues. This allows for proactive management and optimization to ensure efficient operation and performance stability within the Bizagi environment.
Services and Interfaces Long Running Operations - Trends
This widget tracks and displays trends in long-running operations for Services and Interfaces that exceed a specified duration threshold over time. It measures the number of operations exceeding this duration threshold, allowing users to identify patterns and trends related to performance issues. This analysis facilitates proactive management and optimization, ensuring efficient operation and performance stability within the Bizagi environment.
Last Updated 11/19/2025 1:06:12 PM